Figures & data
Table 1. Primer sequence
Figure 1. TP ameliorated DN and reduced podocyte injury in mice. The DN mouse model was induced by HFD feeding combined with injection of STZ in vivo, and treated with TP for 12 weeks. A: fasting glucose value of mice detected using kits B: 24 h UMA in mice; C: HE staining was used to observe the pathological changes of renal tissues and transmission electron microscopy was used to observe the ultrastructural changes of the podocyte in the renal cortex; D: WB was used to detect the level of Nephrin, a marker in renal podococytes of mice; Measurement data were expressed as mean ± standard deviation, N = 10, Kruskal–Wallis univariate ANOVA (k samples) test was used for data comparison among multiple groups. P value was obtained from a bilateral test, ** P < 0.01, *** P < 0.001.
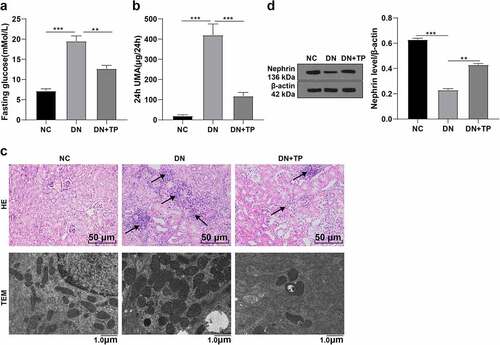
Figure 2. TP inhibited the expression of miR-155-5p in mouse podocytes in vitro and in vivo. In vivo, the DN mouse model was induced by HFD feeding combined with STZ injection, and treated with TP for 12 weeks. In vitro, podocyte injury was induced by HG and podocytes were treated with TP for 48 h. A: The level of miR-155-5p in the kidney tissues of mice was detected by RT-qPCR; B: The level of miR-155-5p in mouse podocytes was detected by RT-qPCR; Measurement data were expressed as mean ± standard deviation, N = 10, the cell experiment was independently repeated 3 times. Kruskal-Wallis univariate ANOVA (k samples) test was used for data comparison among multiple groups. P value was obtained from a bilateral test, ** P < 0.01, *** P < 0.001.
Figure 3. TP alleviated oxidative stress and inflammatory damage in MPC5 cells induced by HG based on miR-155-5p. The podocyte injury was induced by HG and podocytes were treated with TP. Mouse podocytes treated with HG and TP were transfected with miR-155-5p mimics to increase the expression of miR-155-5p. After 48 h of treatment, relevant tests were performed. A: The ROS levels in mouse podocytes were detected by DCFH-DA kits. B-D: The levels of oxidative stress-related enzymes such as MDA, SOD, and GSH in MPC5 cells were detected by ELISA kits. E-H: The levels of Il-1 β, IL-6, TNF-α, and IL-4 in MPC5 cells were detected by ELISA kits; I: The protein levels of IL-1β, IL-6, TNF-α, and IL-4 in MPC5 cells were detected by WB. J: The level of miR-155-5p in mouse podocytes was detected by RT-qPCR; The value of miR-155-5p in Figure J was consistent with that in ; Measurement data were expressed as mean ± standard deviation, the cell experiment was independently repeated 3 times. Kruskal-Wallis univariate ANOVA (k samples) test was used for data comparison among multiple groups. P value was obtained from a bilateral test, * P < 0.05, ** P < 0.01, *** P < 0.001.
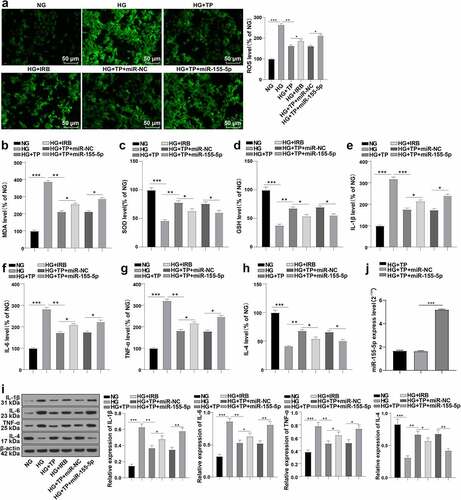
Figure 4. miR-155-5p targeted BDNF. A: The downstream target genes of miR-155-5p were analyzed by bioinformatics website Targetscan, StarBase, and miRDB. B: The bioinformatics software TargetScan predicted the targeted binding sites of miR-155-5p and BDNF; C: Dual-luciferase assay was used to detect the targeted binding sites of miR-155-5p and BDNF; D: The expression of BDNF in mice was detected by RT-qPCR and WB. E: The BDNF expression in mouse podocytes was detected by RT-qPCR and WB. Measurement data were expressed as mean ± standard deviation, N = 10, the cell experiment was independently repeated 3 times. Mann-Whitney U test was used for data comparison between two groups and Kruskal-Wallis univariate ANOVA (k samples) test was used for data comparison among multiple groups. P value was obtained from a bilateral test, ** P < 0.01, *** P < 0.001.
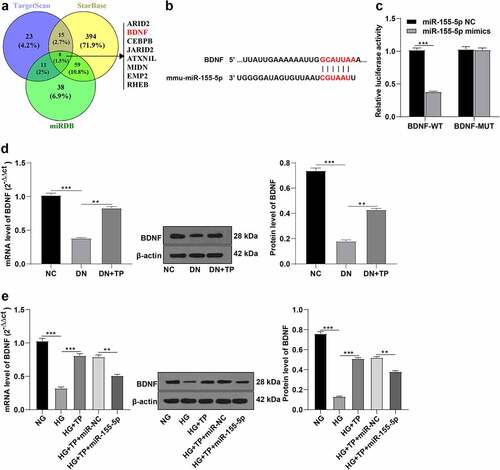
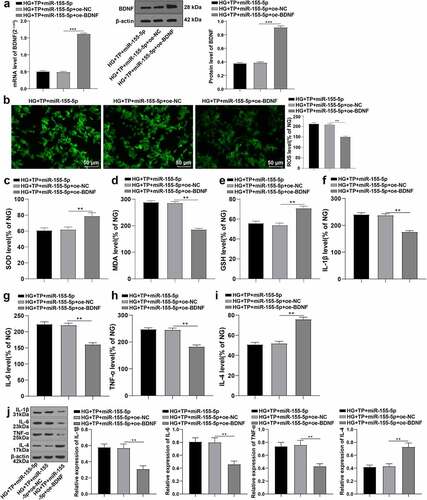
Figure 5. Overexpression of BDNF antagonized the inhibition of overexpression of miR-155-5p on the protective effect of TP on MPC5 cell injury. The miR-155-5p mimics and overexpressed BDNF plasmid were co-transfected into MPC5 cells with HG and TP combined intervention, and related detection was performed 48 h after transfection. A: The level of BDNF in MPC5 cells was detected by RT-qPCR and WB. B: The ROS levels in MPC5 cells were detected by DCFH-DA kit; C-E: The levels of oxidative stress-related enzymes such as MDA, SOD, and GSH in MPC5 cells were detected by ELISA kits. F-I: The levels of IL-1β, IL-6, TNF-α, and IL-4 in MPC5 cells were detected by ELISA kits. J: The protein levels of IL-1β, IL-6, TNF-α, and IL-4 in MPC5 cells were detected by WB. The mRNA value of BDNF in Figure A was consistent with that in ; Measurement data were expressed as mean ± standard deviation, and Kruskal-Wallis univariate ANOVA (k samples) test was used for data comparison among multiple groups. P value was obtained from a bilateral test, ** P < 0.01, *** P < 0.001.