Figures & data
Figure 1. TSPO and PK11195 regulated the levels of IL-1β, IL-6, IL-10, NADPH, TGF-β, and TNF-α of LPS and IFN-γ-induced microglia. (a) The expression of IL-1β in BV2 cells was detected by ELISA. (b) The expression of IL-6 in BV2 cells was detected by ELISA. (c) The expression of IL-10 in BV2 cells was detected by ELISA. (d) The NADPH activity in BV2 cells was detected by ELISA. (e) The expression of TGF-β in BV2 cells was detected by ELISA. (f) The expression of TNF-α in BV2 cells was detected by ELISA. (;P < 0.05, ;;P < 0.01).
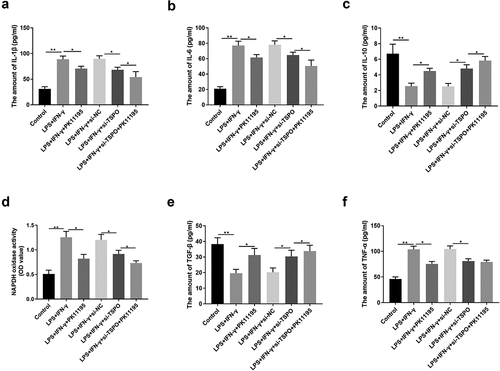
Figure 2. Knockdown of TSPO and PK11195 treatment partly protects microglia from LPS and IFN-γ induced apoptosis. (a) Cell apoptosis is analyzed using TUNEL staining. (b) Bcl-2 and caspase3 protein expression are measured using western blotting. (c) Flow cytometry analysis of apoptotic BV-2 cells. (;P < 0.05, ;;P < 0.01).
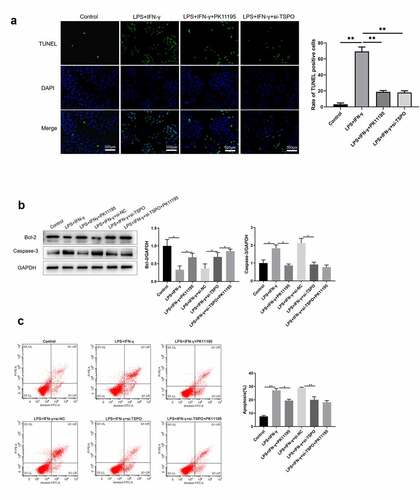
Figure 3. TSPO binds P47. (a) BV2 cells were lysed and immunoprecipitation was carried out with indicated antibodies. The immunocomplexes were subjected to western blot analysis. (b) Immunofluorescence imaging of IBA1, TSPO, P47 and DAPI was captured on the confocal microscope.
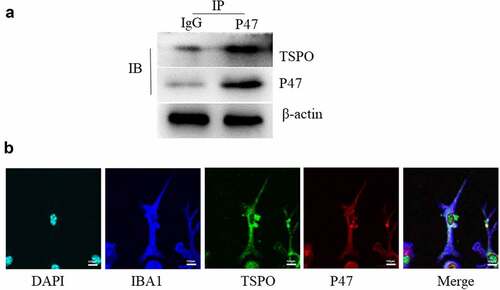
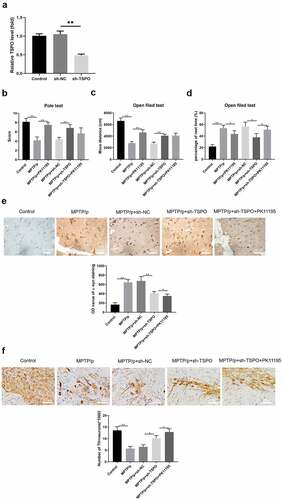
Figure 4. Knockdown of TSPO and PK11195 treatment ameliorated motor dysfunction and dopaminergic neuronal function of MPTP/p PD model mice. (a) The knockdown efficiency of TSPO was calculated. (b) The score of turn around (time of turning) and descend a pole (time of climbing) were recorded for the pole test. (c) The move distance was recorded for the open field test. (d) The rest time was recorded for the open field test. (e) Immunohistochemistry of α-Syn staining. (f) Immunohistochemistry of dopaminergic staining. (*P < 0.05, **P < 0.01).