
Figures & data
Figure 1. Diosmetin alleviates inhibition of SRA01/04 proliferation induced by H2O2 or UVB. (a) The 2D structure of diosmetin; (b) MTT test results of SRA01/04 cells under different conditions; (c) Images captured by the bright filed microscope to show the morphological changes. *P < 0.05 compared with control group, #P < 0.05 compared with 0 μM diosmetin group.
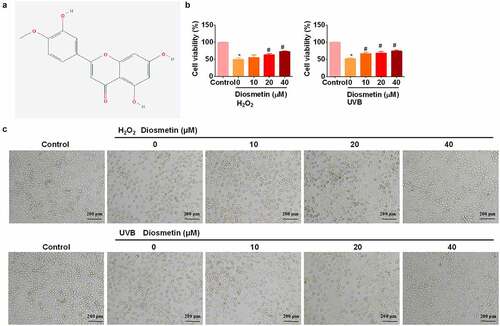
Figure 2. Diosmetin reduced H2O2- and UVB-induced apoptosis of SRA01/04 cells. (a) Cell apoptosis was detected by flow cytometry; (b) The expression of apoptosis-related proteins was detected by western blotting assay. *P < 0.05 compared with control group, #P < 0.05 compared with 0 μM diosmetin group.
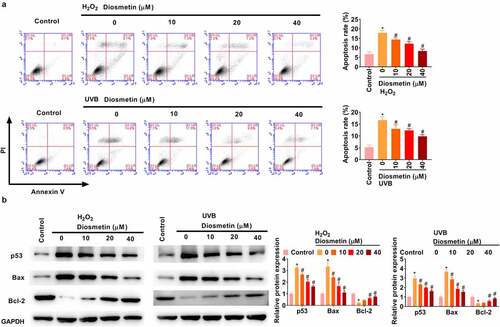
Figure 3. Diosmetin reduces oxidative stress induced by H2O2 and UVB. (a) The detection of the production of ROS in cells under different conditions; The changes of (b) SOD, (c) CAT, and (d) GSH were detected by ELISA under different conditions. *P < 0.05 compared with control group, #P < 0.05 compared with 0 μM diosmetin group.
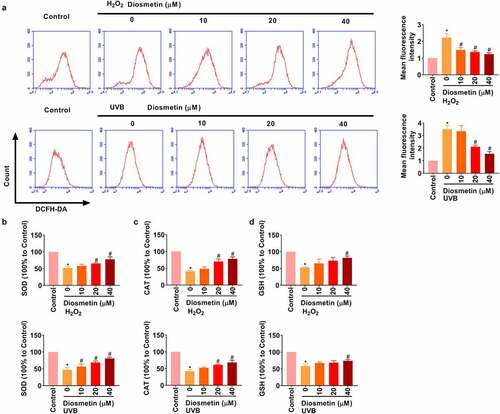
Figure 4. Diosmetin attenuates H2O2- and UVB-induced activation of MAPK signaling pathways. (a) Molecular and pharmacophore models of diosmetin binding MEK2; (b) Molecular interaction analysis of diosmetin and MEK2; (c) Western blot was performed to detect the expression of MEK2 in diosmetin-treated cells; (d) Western blot was used to detect the phosphorylation of MAPK pathway related proteins. *P < 0.05 compared with control group, #P < 0.05 compared with 0 μM diosmetin group.
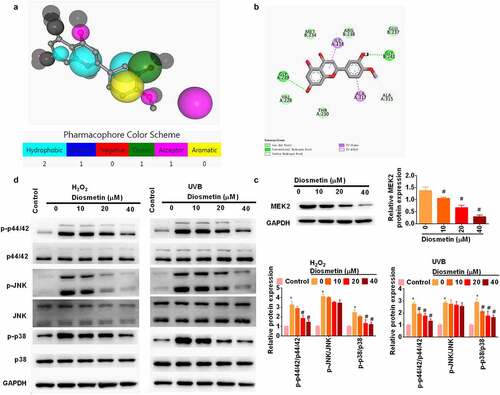
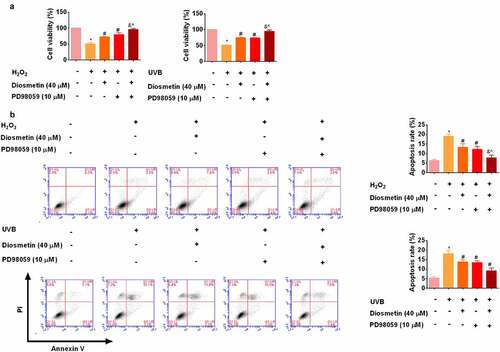
Figure 5. The combination of diosmetin and MEK inhibitor PD98059 reduces H2O2- and UVB-induced proliferation inhibition and apoptosis. (a) MTT test results of SRA01/04 cells under different conditions; (b) Cell apoptosis was detected by flow cytometry. * P < 0.05 compared with control group; # P < 0.05 compared with 0 μM diosmetin, 0 μM PD98059 group; & P < 0.05 compared with 40 μM diosmetin, 0 μM PD98059 group; ^P < 0.05 compared with 0 μM diosmetin, 10 μM PD98059 group.
Supplemental Material
Download Zip (1.2 MB)Data availability statement
The datasets used and analyzed during the current study are available from the corresponding author (E-mail: [email protected]) on reasonable request.