Figures & data
Figure 1. SNF5 expression status in human lung cancer samples. a. In comparison with the SNF5 mRNA expression in non-tumor tissues(n = 59) and tumor tissue(n = 515) using TCGA database. b. The relation between the expression of SNF5 and the overall survival (OS) of lung cancer patients by database. c. In comparison with the SNF5 mRNA expression in non-tumor tissues(n = 65) and tumor tissue(n = 91) using Hou_2010 NSCLC database. d. The relation between the expression of SNF5 and the overall survival (OS) of NSCLC patients by database. e. In comparison with the SNF5 mRNA expression in non-tumor tissues(n = 15) and tumor tissue(n = 29) using Baty_2010 NSCLC database. f. The relation between the expression of SNF5 and the overall survival (OS) of NSCLC patients by database.
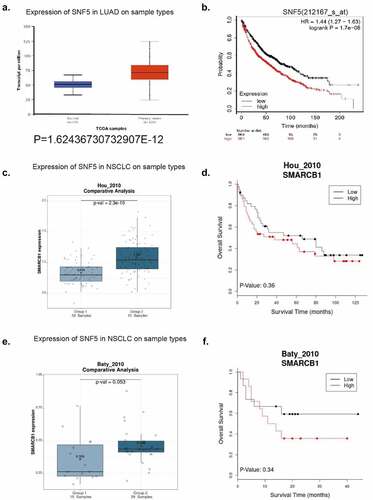
Table 1. Correlation of SNF5 expression and clinicopathological parameters in NSCLC patients
Figure 2. SNF5 contributes to cell proliferation in NSCLC. a. RT-qPCR analysis of the expression of SNF5 in A549 and H1299 cell lines. b. Western blot analysis of SNF5 expression in A549 and NCI-H1299 cell lines. c. RT-qPCR analysis statistics of the expression of SNF5 in A549-EGFP and A549-SNF5 cells. d. Western blot analysis of the expression of SNF5 in A549-EGFP and A549-SNF5 cells. e. RT-qPCR analysis of the expression of p21 and cyclin D1 in A549-EGFP and A549-SNF5 cells. f. Western blot analysis of the expression of p21 and cyclin D1 in A549-EGFP and A549-SNF5 cells. g. CCK8 assay analysis the proliferation of A549-EGFP and A549-SNF5 cells. h. RT-qPCR analysis statistics of the expression of SNF5 in H1299-NC and H1299-siSNF5 cells. i. Western blot analysis of the expression of SNF5 in H1299-NC and H1299-siSNF5 cells. j. RT-qPCR analysis statistics of the expression of p21 and cyclin D1 in H1299-NC and H1299-siSNF5 cells. k. Western blot analysis of the expression of p21 and cyclin D1 in H1299-NC and H1299-siSNF5 cells. l. CCK8 assay analysis the proliferation of H1299-NC and H1299-siSNF5 cells. (n = 3, *P < 0.05, **P < 0.01, ***P < 0.001).
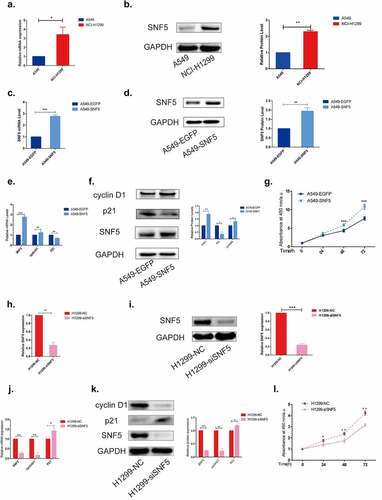
Figure 3. SNF5 plays an important role in regulating NSCLC immune escape. a. RT-qPCR analysis statistics of the expression of PD-L1, PD-L2, TGF-β1 and IDO1 in A549-EGFP and A549-SNF5 cells. b. Western blot analysis statistics of the expression of PD-L1, PD-L2, TGF-β1 and IDO1 in A549-EGFP and A549-SNF5 cells. c. CCK-8 assay analysis of A549-EGFP and A549-SNF5 cell lysis when co-cultured with T cells after 24 h with ratio 1:1(up) or 5:1(down). d. RT-qPCR analysis statistics of the expression of PD-L1, PD-L2, TGF-β1 and IDO1 in H1299-NC and H1299-siSNF5 cells. e. Western blot analysis statistics of the expression of PD-L1, PD-L2, TGF-β1 and IDO1 in H1299-NC and H1299-siSNF5 cells. Ff. CCK-8 assay analysis of H1299-NC and H1299-siSNF5 cell lysis when co-cultured with T cells after 24 h with ratio 1:1(up) or 5:1(down). (n = 3, *P < 0.05, **P < 0.01, ***P < 0.001).
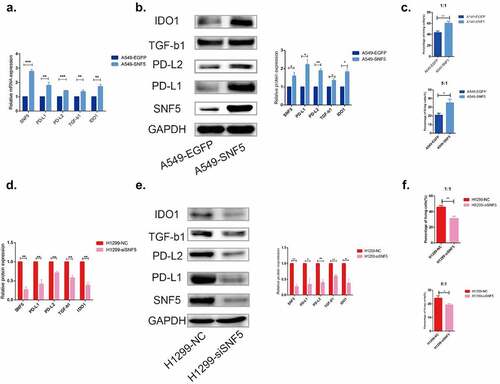
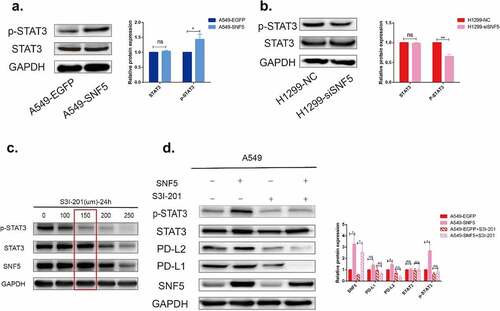
Figure 4. SNF5 regulates immune escape through STAT3/p-STAT3 signaling pathway in NSCLC cells. a. Representative images show STAT3 and p-STAT3 protein expression in A549 cells that recombinantly express SNF5 or EGFP. b. Representative images show STAT3 and p-STAT3 protein expression in H1299-NC and H1299-siSNF5 cells. c. Screening the optimum treatment duration and concentration of S3I201. d. A549-EGFP and A549-SNF5 cells were treatment with S3I201(150 µm) or DMSO for 24 h. Protein expressions of p-STAT3, STAT3, PD-L2 and PD-L1 were detected by western blotting. (n = 3, *P < 0.05, **P < 0.01).