Figures & data
Figure 1. The time chart of induction and treatment process in mice with gouty arthritis
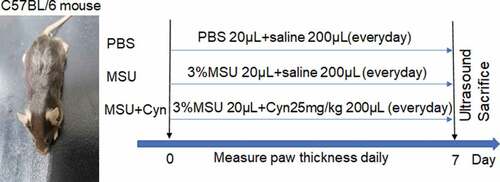
Table 1. Sequences of primers used in the qRT-PCR
Figure 2. Cynarin reduced hind paws swelling in mice with gouty arthritis. (a) After 7 days, changes in hind paws of mice with gouty arthritis. (b) The hind paws of mice were measured and recorded daily using vernier calipers. (c) After 7 days, the swelling of the hind paws of mice was measured using an ultrasound, and the results were displayed in B-mode and 3D-mode. (d) Data were collected using ultrasound software. Data were shown as mean ± standard deviation (SD) of ten mice per group. *p<0.05, **p<0.01, ***p<0.001 VS. MSU group. ###p<0.001 VS. PBS group.
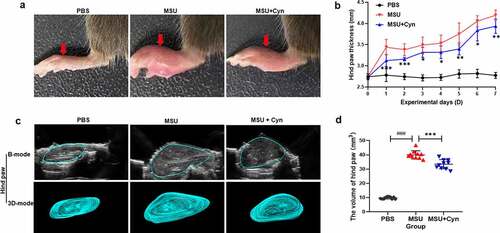
Figure 3. The effect of Cyn on kidney and liver tissues. (a, b) Hematoxylin-eosin staining of kidney and liver tissues. The scale in the figure is 50μm.
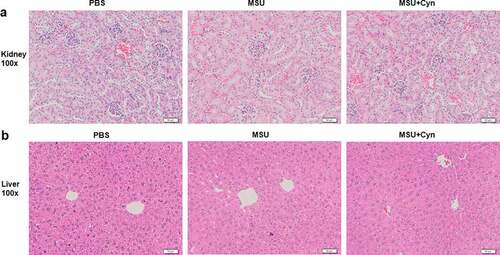
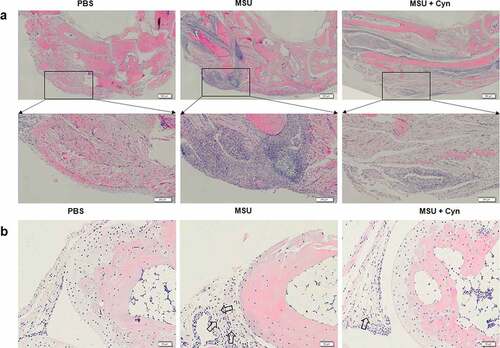
Figure 4. Cynarin inhibited the infiltration of inflammatory cells. (a) The hind paws of mice were stained with hematoxylin and eosin (HE). the scale in the figure is 500μm and 200μm. (b) Synovial tissues of mouse hind paw metatarsophalangeal joint. the scale in the figure is 50μm. (c) Statistics and analysis of the proportion of inflammatory area on the hind paws after HE staining. (d) The hind paws of the mice were stained with immunofluorescence. the scale in the figure is 20μm. (e) Statistics and analysis of the percentage of positive area on the hind paws of mice after immunofluorescence staining. Data were shown as mean ± standard deviation (SD) of ten mice per group. ***p<0.001 VS. MSU group, ###p<0.001 VS. PBS group.
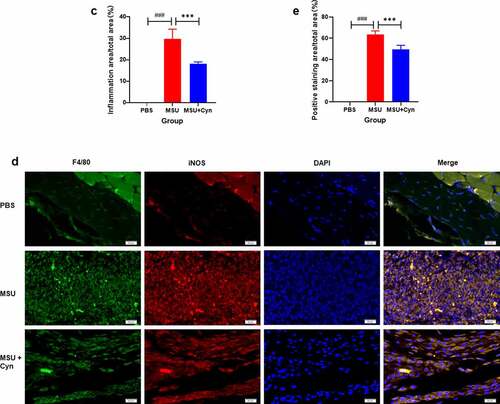
Figure 5. The effect of Cynarin on BMDMs and inflammatory factors. (a) CCK-8 kit detected the effect of Cyn on BMDMs. (b-e) After BMDMs were processed, the relative expression of inflammatory factors mRNA was detected. (f-i) After RNA extraction on the hind paws of mice, the relative expression of inflammatory factors mRNA was detected. Data were shown as mean ± standard deviation (SD) of three independent experiments. *p<0.05, **p<0.01, ***p<0.001 VS. MSU group or the group handled by LPS and MSU together. ##p<0.01, ###p<0.001 VS. PBS group or the group without LPS, MSU and Cyn.
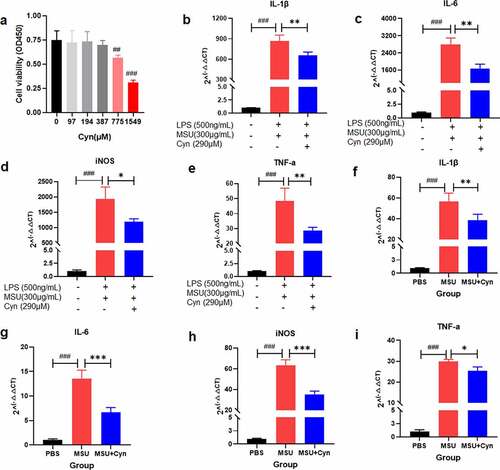
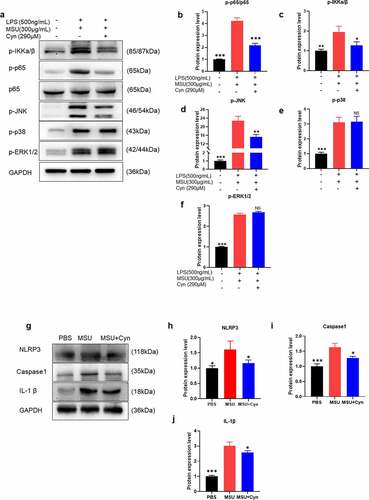
Figure 6. Cynarin inhibits the activation of NF-κB, JNK pathway and NLRP3 inflammasome induced by MSU. (a-j) Western blotting detected the protein levels of p-p38, p-ERK1/2, p-JNK, p-p65, p65, p-IKKa/β, Caspase1, NLRP3 and IL-1β, and analyzed these protein. Data were shown as mean ± standard deviation (SD) of three independent experiments. NS p>0.05, *p<0.05, **p<0.01, ***p<0.001 VS. the group handled by LPS and MSU together.