Figures & data
Table 1. Human dataset resources
Figure 1. PRISMA flow.
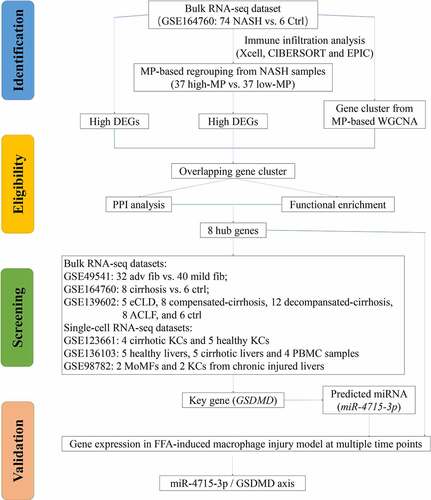
Figure 2. (a) Both significantly up- and downregulated DEGs were screened out from GSE164760 and displayed in the volcano plot. (b) Top significantly up- and downregulated genes were displayed in a heatmap. (c) Functional enrichment was analyzed with GSEA. p < 0.05 is regarded as statistical significance.
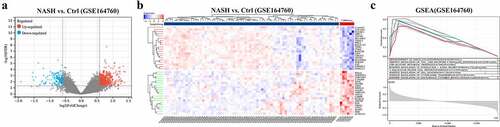
Figure 3. Immune infiltration of GSE164760 is assessed with Xcell (a), CIBERSORT (b), and EPIC (c). Enrichment of MP clusters (total MP, M1-MP, and M2-MP) from GSE89632 (d), GSE49541 (e), and GSE139602 (f) are shown in plots. p < 0.05 (‘*’) is regarded as statistical significance.
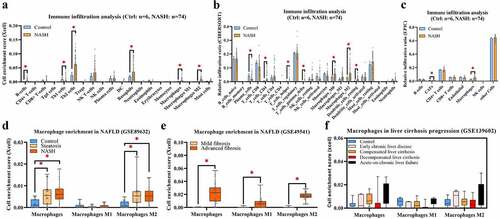
Figure 4. (a) NASH samples of GSE164760 are grouped with MP ES from Xcell (low MP: ES = 0 and high MP >0). (b) Both significantly up- and downregulated DEGs were screened out from regrouped NASH samples of GSE164760 and displayed in the volcano plot. MP-associated gene cluster is selected with WGCNA. Module–trait relationships (c) and cluster dendrogram (d) are shown in charts. (e) 171 overlapping genes are generated from high DEGs of GSE164760 and regrouped NASH samples, as well as WGCNA gene cluster. GO enrichment analysis (f) and PPI analysis (g) are carried out from 171 overlapping genes. Hub genes are labeled in red and round shape. p < 0.05 is regarded as statistical significance.
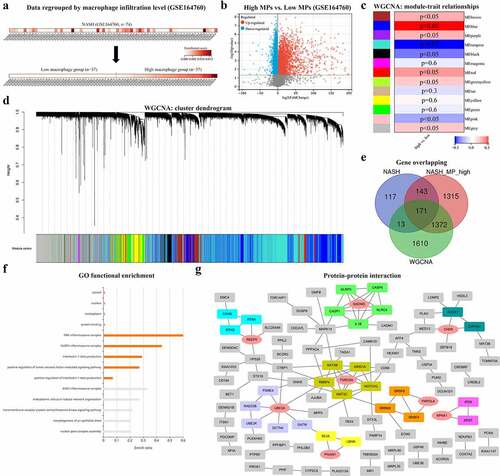
Figure 5. Expressions of eight hub genes are compared, respectively, from GSE49541 (a), GSE1647560 (b), GSE139602 (c), and GSE123661 (d). (e) Distribution of cell populations and disease conditions are generated from GSE136103 with tSNE. (f) Expression of GSDMD is shown in multiple cell populations from GSE136103. p < 0.05 is regarded as statistical significance.
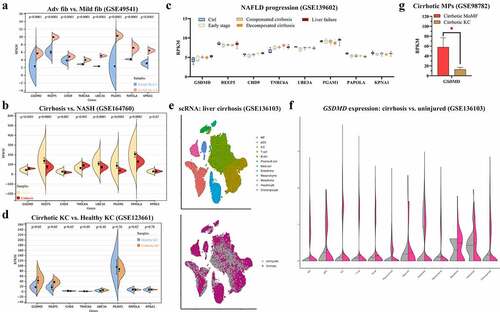
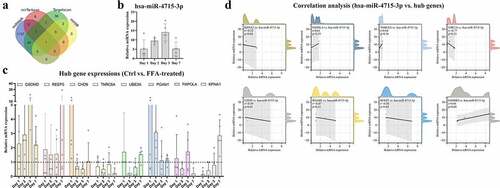
Figure 6. (a) hsa-miR-4715-3p is screened out from GSDMD-associated miRNAs. Expressions of hsa-miR-4715-3p (b) and eight hub genes (c) in FFA-treated THP1-derived macrophages are displayed. (d) Pearsoncorrelation analysis is conducted,respectively, between hsa-miR-4715-3p and eight hub genes. p < 0.05 is regarded as statistical significance.