Figures & data
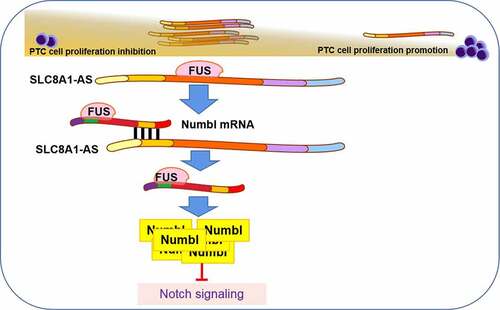
Figure 1. SLC8A1-AS is down-regulated in PTC tissues and cell lines. (a) The expression of SLC8A1-AS1 in the clinical PTC samples (n = 272) and the normal samples (n = 48) from the TCGA database. (b) The expression of SLC8A1-AS1 in different stages of PTC from the TCGA database. (c) The expression of SLC8A1-AS1 in the PTC samples (n = 5) and the adjacent tissue samples (n = 5) from the GEO database (GSE66783). (d) Kaplan-Meier DFI survival plots in PTC patients from the TCGA database. (e) Cox risk analysis of PTC samples from the TCGA database. (f) The expression of SLC8A1-AS1 was measured by qPCR in the Nthy-ori 3–1, TPC-1, and B-CPAP cells. Data are presented as the mean ± SD of three independent measurements. ** P < 0.01, * P < 0.05.
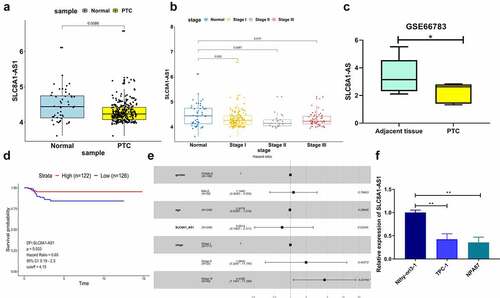
Figure 2. The overexpression of SLC8A1-AS reduces proliferation and induces apoptosis of PTC cells. (a) The expression of SLC8A1-AS1 was measured by qPCR. (b) The cell viability was analyzed by CCK-8 assays. (c) The cell apoptosis was measured by flow cytometry analysis. Data are presented as the mean ± SD of three independent measurements. ** P < 0.01.
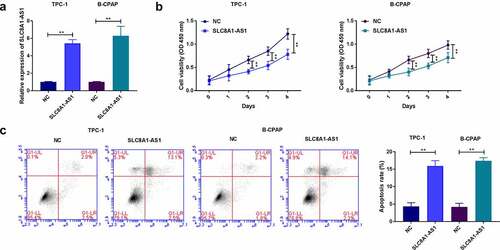
Figure 3. SLC8A1-AS attenuates invasion and migration of PTC cells. (a) The migration was assessed by wound healing assays. (b) The cell migration and invasion were analyzed by Transwell assays. Data are presented as the mean ± SD of three independent measurements. ** P < 0.01.
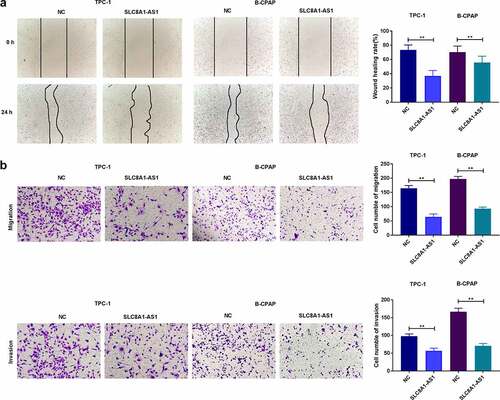
Figure 4. SLC8A1-AS is able to inhibit Notch signaling in PTC cells. (a) The association of SLC8A1-AS1 with Notch signaling was identified in the GSEA using clusterProfiler R package. (b) Kyoto Encyclopedia of Genes and Genomes (KEGG) Pathway map of Notch signaling pathway. (c) The expression of Numb, Numbl, Notch1, and Hes1 was analyzed by western blot. Data are presented as the mean ± SD of three independent measurements. ** P < 0.01.
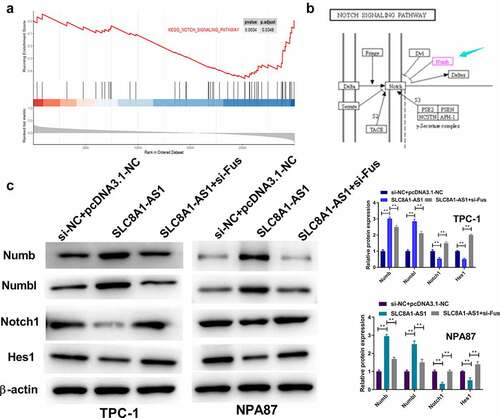
Figure 5. SLC8A1-AS maintains Numbl stability by interacting with FUS in PTC cells. (a) The overlap analysis of the potential interacting RBPs with SLC8A1-AS1 and Numbl mRNA was performed using the starbase database. (b and c) The potential binding probability of SLC8A1-AS1 and Numbl mRNA with FUS was analyzed using the RPISeq database. (d and e) The interaction of FUS with SLC8A1-AS1 and Numbl was assessed by RIP assays in TPC-1 and B-CPAP cells. (f-g) The mRNA expression of Numbl was determined by qPCR assays in the cells. Data are presented as the mean ± SD of three independent measurements. ** P < 0.01.
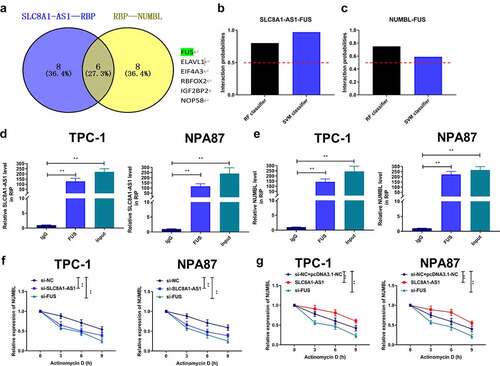
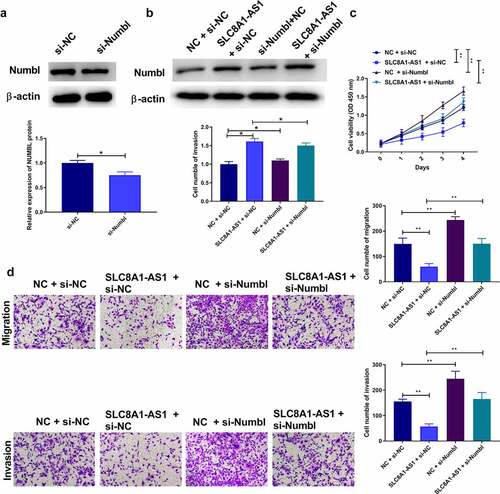
Figure 6. SLC8A1-AS attenuates malignant progression of PTC cells via regulating Numbl. (a-b) The protein expression of Numbl was examined by western blot. (c) The cell viability was analyzed by CCK-8 assays. (d) The cell migration and invasion were analyzed by Transwell assays. Data are presented as the mean ± SD of three independent measurements. ** P < 0.01.