Figures & data
Figure 1. Copy number variation of LINC00313 correlates with tumor immune invasion in TGCT.
(A) Stacked plot showing the proportional distribution of copy number variation of LINC00313 in TGCT; (B) Bubble plot of heterozygous copy number variation of LINC00313 in TGCT; (C) Bubble plot of homozygosis copy number variation of LINC00313 in TGCT; (D) Correlation between LINC00313 and the immune infiltration score, CD8 + T cell infiltration, and DC cell infiltration in TGCT. (E&F) The correlation between the copy number of LINC00313 and the DFI and PFI of patients with TGCT. CNV: Copy Number Variation; TGCT: Testicular Germ Cell Tumor; Homo: Homozygous; Amp: Amplification; Del: Deletion; cor: correlation; FDR: False Discovery Rates; DC: dendritic cells; TCGA: The Cancer Genome Atlas; DFI: Disease free interval; PFI: Progression free interval.
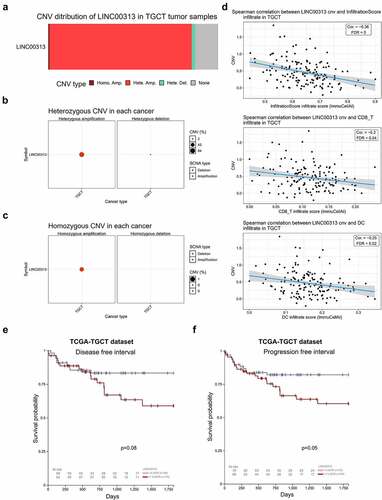
Figure 2. Expression of LINC00313 correlates with the clinicopathological features of patients with TGCT.
(A) GEO database analysis shows that LINC00313 was notably upregulated in TGCT. (B & C) GEO database showing that LINC00313 was notably upregulated across different subtypes of TGCT. (D, E & F) The expression of LINC00313 has high sensitivity and specificity for distinguishing normal samples from TGCT samples, seminoma samples, non-seminoma samples. (G & H) The correlation between LINC00313 and the DFI and PFI of patients with TGCT. GEO: Gene Expression Omnibus; AUC: Area Under The Curve.
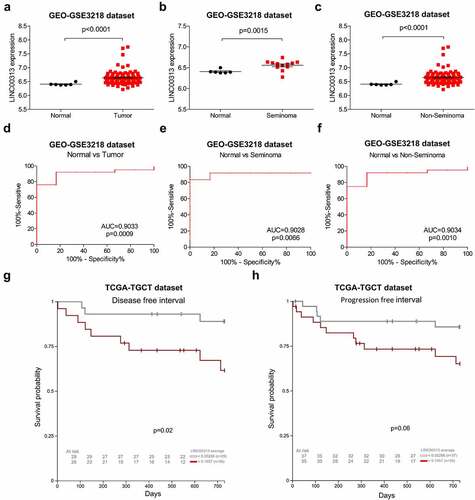
Figure 3. The impact of LINC00313 on the migratory and invasive properties of TGCT. (A) The silencing efficiency of LINC00313 siRNA on the TGCA cell line was assessed using qRT-PCR. (B&C) Transwell cell migration assays enabled an assessment of how LINC00313 silencing affected TGCT cell migration (D&E) Transwell cell invasion assays enabled an assessment of how LINC00313 silencing affected TGCT cell invasion. NC: Negative Control; siRNA: small interfering RNA.
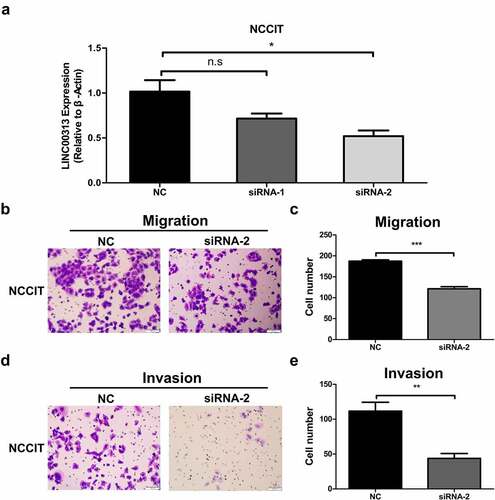
Figure 4. Effects of silencing of LINC00313 on EMT-related proteins were investigated using Western blotting experiments.
(A–E) The association between LINC00313 and EMT markers were analyzed with the GEPIA database (F) After silencing of LINC00313, the levels of VIM, ZEB1, SNAIL, CTNNB1, and CDH2 were downregulated significantly. (G) LINC00313-miRNA-gene interaction network. TPM: Transcripts Per Kilobase Million.
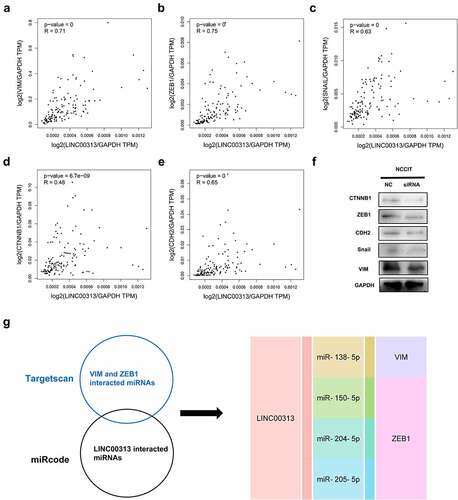
Figure 5. Establishing a prognostic EMT-related gene risk signature for TGCT patients in the TCGA TGCT cohort. (A)LASSO Cox regression of the 5 EMT-related genes regulated by LINC00313. (B) Screening of the parameter in the LASSO Cox regression. (C) After dividing patients into high- and low-risk groups, the risk distribution, survival, and expression of 4 related genes for each patient was displayed. (D) Significant differences of DFS were observed between high-and low-risk TCGA TGCT patients (E) ROC curves exhibits the predictive sensitivity and specificity of the risk score at 1, 3, and 5 years. HR: hazard ratio.
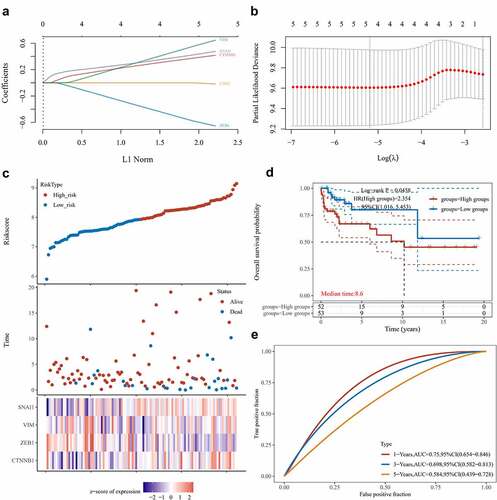
Figure 6. Relationship between LINC00313 and immune cells and immune pathways in the TGCT immune microenvironment. (A) Correlation between LINC00313 and immune score. (B) Correlation between LINC00313 and stromal score. (C) Difference in immune cell score between high and low expression of LINC00313 in TGCT patients. (D) Correlation between LINC00313 and immune cell enrichment scores. (E) Differential expression of immune checkpoint genes between high and low expression of LINC00313 in TGCT patients. (F) Correlation between LINC00313 and the enrichment scores of various immune-related pathways. G1: LINC00313 high group; G2: LINC00313 low group. Est: Estimation; ES: Enrichment score.
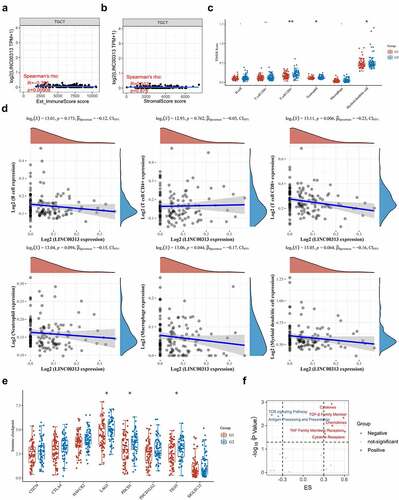
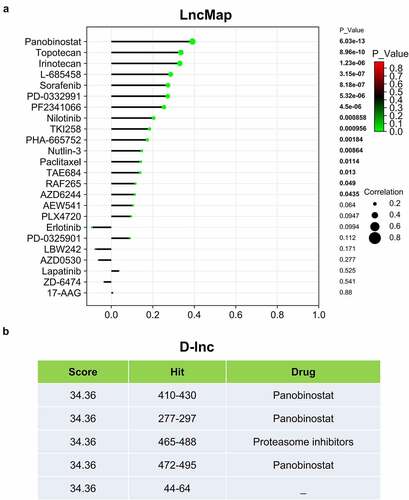
Figure 7. LINC00313 related drug screening. (A) LncMap analysis of the correlation between LINC00313 expression and the IC50 of various drugs. (B) D-lnc online tool predicts the score and binding site of drugs that may interact with LINC00313. Hit represents the position where the drug acts on LINC00313.