Figures & data
Table 1. The primer sequences for real-time PCR
Figure 1. The effect of H/R exposure on HIF-1α, FOXO3a, miR-135b-5p, and PIK3R2 levels. (a) After exposure to hypoxia (2% O2 for 8 h) and reoxygenation (20% O2 for 16 h), HIF-1α levels in HTR8/SVneo cells were determined by real-time PCR (internal control: GAPDH). (b) Real-time PCR analysis of FOXO3a (internal control: GAPDH). (c) Real-time PCR analysis of miR-135b-5p (internal control: U6). (d) Real-time PCR analysis of PIK3R2 (internal control: GAPDH). **P < 0.01 vs. Control group.
Figure 2. MiR-135b-5p overexpression enhances cell proliferation, migration, and invasion under H/R conditions. (a) HTR8/SVneo cells were transfected with miR-135b-5p mimic/NC mimic and then miR-135b-5p levels were determined by real-time PCR (internal control: U6). (b) HTR8/SVneo cells were transfected with miR-135b-5p inhibitor/NC inhibitor. Green fluorescence was observed using a fluorescence microscope. Scale bar represents 250 μm. (c) After H/R exposure and cell transfection, miR-135b-5p levels were determined by real-time PCR (internal control: U6). (d) Cell proliferation was evaluated by CCK-8 assay. (e) Cell migration was analyzed by transwell migration assay. Scale bar represents 100 μm. (f) Cell invasion was analyzed by transwell invasion assay. Scale bar represents 100 μm.**P < 0.01 vs. NC mimic group or Control group. ##P < 0.01 vs. H/R+ NC mimic group. &P < 0.05, &&P < 0.01 vs. H/R+ NC inhibitor group.
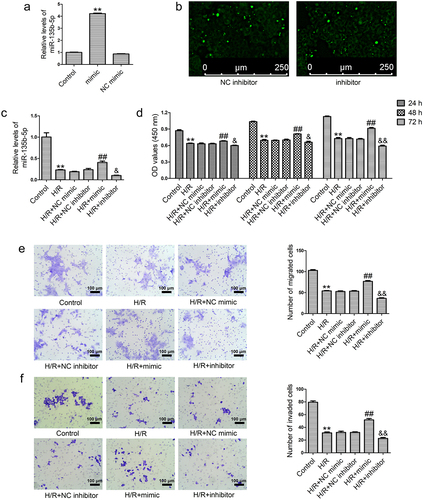
Figure 3. MiR-135b-5p overexpression accelerates angiogenesis in HTR8/SVneo cells under H/R conditions. (a) HTR8/SVneo cells were transfected with miR-135b-5p mimic/NC mimic/miR-135b-5p inhibitor/NC inhibitor after H/R treatment. PIK3R2 levels were determined by real-time PCR (internal control: GAPDH). (b) VEGF, PIGF, and sFlt-1 levels were determined by real-time PCR (internal control: GAPDH). **P < 0.01 vs. Control group. ##P < 0.01 vs. H/R+ NC mimic group. &&P < 0.01 vs. H/R+ NC inhibitor group.
Figure 4. PIK3R2 knockdown enhances the effects of miR-135b-5p overexpression on proliferation and apoptosis of H/R-exposed cells. (a) HTR8/SVneo cells were transfected with PIK3R2 shRNA-1/-2/-3 or NC shRNA. PIK3R2 levels were determined by real-time PCR (internal control: GAPDH). (b) PIK3R2 levels were determined by western blotting (internal control: GAPDH). (c) HTR8/SVneo cells were transfected with miR-135b-5p mimic/PIK3R2 shRNA/NC shRNA alone, or co-transfected with miR-135b-5p mimic and PIK3R2 shRNA/NC shRNA after H/R treatment. MiR-135b-5p levels were determined by real-time PCR (internal control: U6). (d) Cell proliferation was determined by CCK-8 assay. (e) Cell apoptosis was measured by flow cytometry. **P < 0.01 vs. NC shRNA group or Control group. ##P < 0.01 vs. H/R group. &P < 0.05, &&P < 0.01 vs. H/R+ NC shRNA group. $P < 0.05, $$P < 0.01 vs. H/R+ mimic+NC shRNA group and ns indicates not significant.
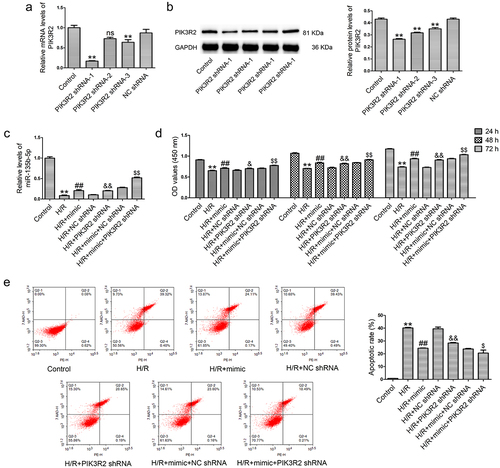
Figure 5. PIK3R2 knockdown enhances the effects of miR-135b-5p overexpression on angiogenesis-associated genes in H/R-exposed cells. (a) PIK3R2 levels were determined by real-time PCR (internal control: GAPDH). (b) PIK3R2 levels were determined by western blotting (internal control: GAPDH). (c) VEGF, PIGF, and sFlt-1 levels were determined by western blotting (internal control: GAPDH). **P < 0.01 vs. Control group. ##P < 0.01 vs. H/R group. &&P < 0.01 vs. H/R+ NC shRNA group. $P < 0.05, $$P < 0.01 vs. H/R+ mimic+NC shRNA group.
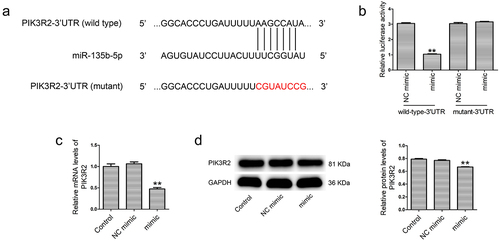
Figure 6. PIK3R2 is a target of miR-135b-5p. (a) The binding relationship between miR-135b-5p and PIK3R2 was predicated using bioinformatic analysis (TargetScan and miRDB). (b) A dual-luciferase reporter assay was performed to verify binding of miR-135b-5p to the PIK3R2-3ʹUTR. (c) PIK3R2 expression was determined by real-time PCR (internal control: GAPDH). (d) PIK3R2 expression was determined by western blotting (internal control: GAPDH). **P < 0.01 vs. NC mimic+wild-type-3ʹUTR group or NC mimic group.