Figures & data
Table 1. Clinical characteristics of HCC patients in TCGA database.
Table 2. Univariate and multivariate regression analysis were used to evaluate survival related factors.
Figure 1. Rg3 combined with SFN inhibited cell viability of the HCC cells. (a) molecular structure formula of Rg3. (b-c) cell viability of the HCC cells was determined by MTT assay. **P < 0.01 VS NC group. #P < 0.05 VS SFN or Rg3 group. &P < 0.05 VS SFN+ Rg3 group.
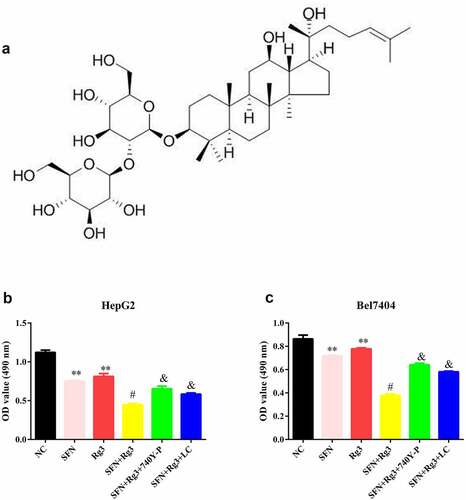
Figure 2. Rg3 combined with SFN declined the glucose consumption and lactate levels of the HCC cells. (a-b) the glucose consumption of the HCC cells. (c-d) THE lactate levels of the HCC cells. *P < 0.05, **P < 0.01 VS NC group. #P < 0.05 VS SFN or Rg3 group. &P < 0.05 VS SFN+ Rg3 group.
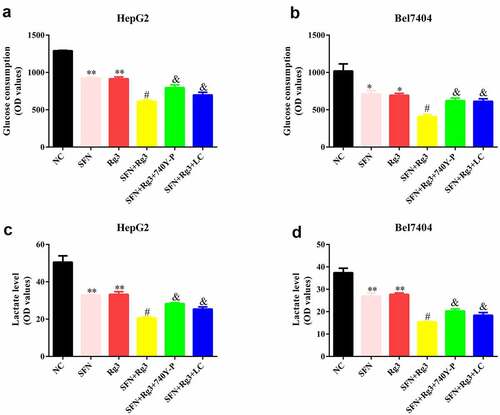
Figure 3. HK2 was up-regulated in the HCC patient. (a) the HK2 mRNA levels of the HCC patients. (b) ROC curve analysis of HCC patients. (c-d) TCGA cohort and Kaplan-Meier Plotter analysis was used to draw the overall survival curve.
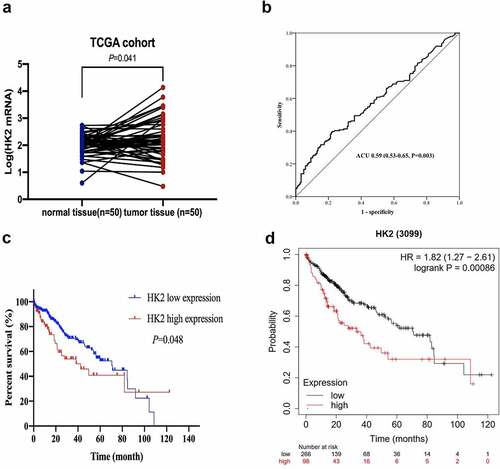
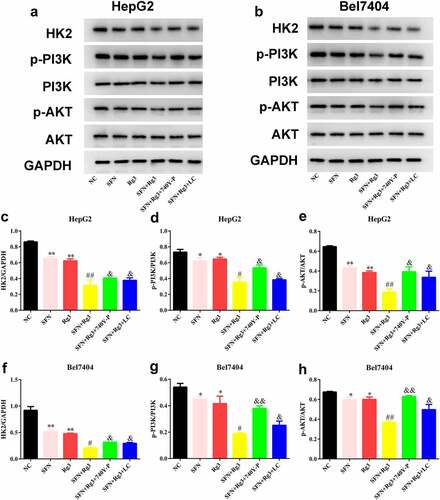
Figure 4. Rg3 combined with SFN suppressed the PI3K/Akt signaling pathway and HK2 levels. (a-h) the protein expressions of HK2, PI3K, Akt of the HCC cells were detected by western blots. *P < 0.05, **P < 0.01 VS NC group. #P < 0.05, ##P < 0.01, VS SFN or Rg3 group. &P < 0.05, &&P < 0.01 VS SFN+ Rg3 group.