
Figures & data
Figure 1. ZFAS1 levels in OA cartilage and LPS-induced chondrocytes. (a) Relative ZFAS1 expression in non-OA samples (n = 10) and OA cartilage samples (n = 25) was detected through qRT-PCR. (b) Chondrocytes were exposed to 0.5 μM LPS for 1 day. * P < 0.05, ** P < 0.01.
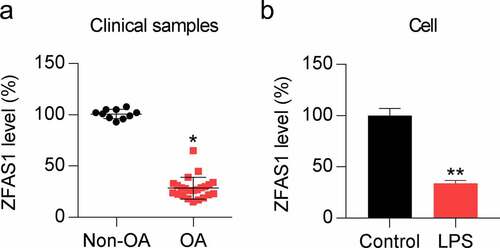
Figure 2. Influence of ZFAS1 overexpression on growth, oxidative stress, inflammation, and apoptosis of LPS-treated chondrocytes. Chondrocytes were exposed to pcDNA3.1-empty (NC) or pcDNA3.1-ZFAS1 (ZFAS1) transfection for one day and then exposed to 0.5 μM LPS for another day. (a) ZFAS1 level was analyzed through qRT-PCR. (b) The cell growth rate on days 1, 2, and 3 was determined after transfection through MTT assay. (c) Soft agar CFA of LPS-treated chondrocytes. The colony number is displayed in the right panel. (d) DCFH-DA staining was conducted to evaluate ROS production. (e, f) Activity levels of the anti-oxidative enzymes SOD and catalase were determined via corresponding assay kits. (g) WB was used to detect HO-1 and Nrf2 protein levels in the chondrocytes. (h) FC was used for evaluating the number of apoptotic cells. The apoptosis rate of LPS-treated chondrocytes is shown in the lower right panel. (i) ELISA was used for analyzing the production of pro-inflammatory cytokines in LPS-treated chondrocytes vs. control group (* P < 0.05, ** P < 0.01, *** P < 0.001), and LPS-treated chondrocytes vs. LPS+OE-NC group ($ P < 0.05, $$ P < 0.01).
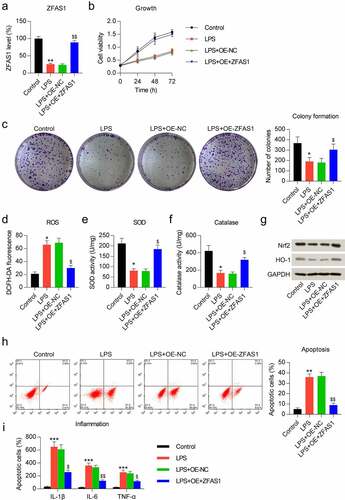
Figure 3. ZFAS1 acts as a ceRNA of miR-1323. (a) Graphical representation of the conserved ZFAS1 binding motif at miR-1323. (b) DLRA was conducted using the luciferase reporter constructs that contained either the ZFAS1 Mut or WT sequences after miR-1323/NC mimic transfection. The firefly luciferase activity was standardized to Renilla luciferase activity. (c) Chondrocytes were exposed to pcDNA3.1-empty (NC) or pcDNA3.1-ZFAS1 (ZFAS1) transfection for one day and then treated with 0.5 μM LPS for another day. The miR-1323 level was assessed using qRT-PCR. LPS-treated chondrocytes vs. indicated or control group (*, P < 0.05, **, P < 0.01); LPS-treated chondrocytes vs. LPS+OE-NC group ($, P < 0.05).
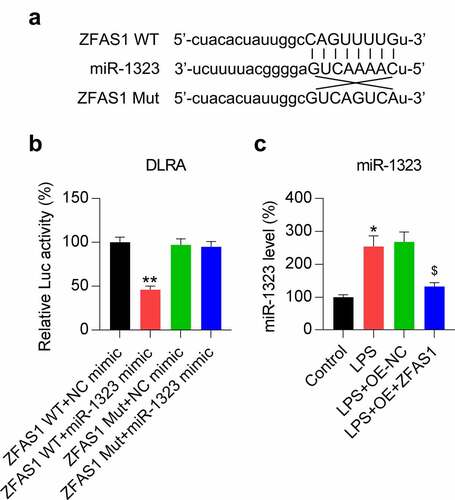
Figure 4. Influence of miR-1323 upregulation on cell growth, oxidative stress, inflammation, and apoptosis of ZFAS1-overexpressing LPS-treated chondrocytes. Chondrocytes were exposed to pcDNA3.1-ZFAS1 (ZFAS1), NC/miR-1323 mimic co-transfection for one day and then exposed to 0.5 μM LPS for another day. (a) The miR-1323 level was analyzed through qRT-PCR. (b) The cell growth rate on days 1, 2, and 3 was determined after transfection through MTT assay. (c) Soft agar CFA of LPS-treated chondrocytes. The colony number is displayed in the right panel. (d) DCFH-DA staining was conducted to evaluate ROS production. (e, f) Activity levels of the anti-oxidative enzymes SOD and catalase were determined via the corresponding assay kits. (g) WB was used to detect the HO-1 and Nrf2 protein levels in the chondrocytes. (h) FC was used for evaluating the apoptotic cell number. The apoptosis rate of LPS-treated chondrocytes is shown in the lower right panel. (i) ELISA was used to analyze the production of pro-inflammatory cytokines in chondrocytes. * P < 0.05.
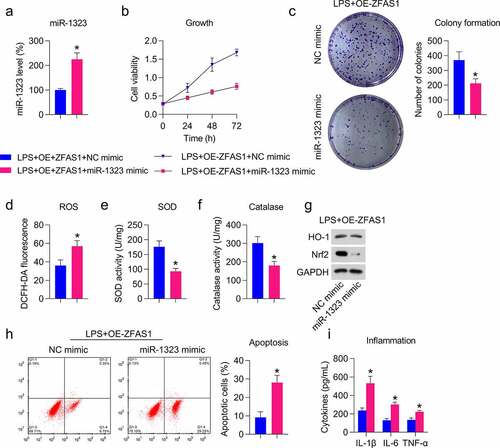
Figure 5. miR-1323 targets the 3′-UTR of Nrf2. (a) Graphical depiction of the conserved miR-1323 binding motif at the Nrf2 3′-UTR. (b) DLRA was conducted using the luciferase reporter constructs, which contained either the Mut or WT of Nrf2 after miR-1323/NC mimic transfection. The firefly luciferase activity was standardized to Renilla luciferase activity. (c) Chondrocytes were exposed to pcDNA3.1-empty (NC) or pcDNA3.1-ZFAS1 (ZFAS1) transfection for one day and then treated with 0.5 μM LPS for another day. qRT-PCR was conducted to assess the Nrf2 mRNA level. (d) Chondrocytes were exposed to pcDNA3.1-ZFAS1 (ZFAS1), NC/miR-1323 mimic co-transfection for one day and then treated with 0.5 μM LPS for another day. qRT-PCR was conducted to evaluate the level of Nrf2 mRNA. LPS-treated chondrocytes vs. indicated or control or LPS+OE-ZFAS1+ NC mimic group (* P < 0.05, ** P < 0.01); LPS-treated chondrocytes vs. LPS+OE-ZFAS1 + 1323 mimic group ($$ P < 0.01).
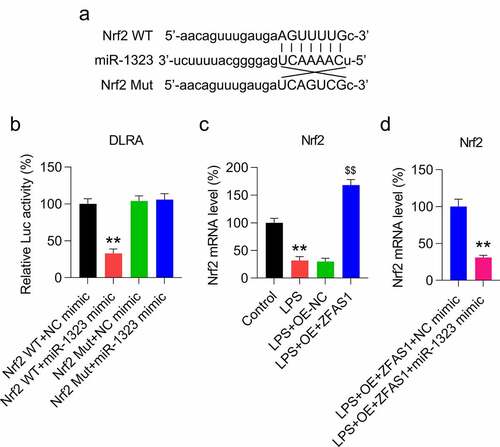
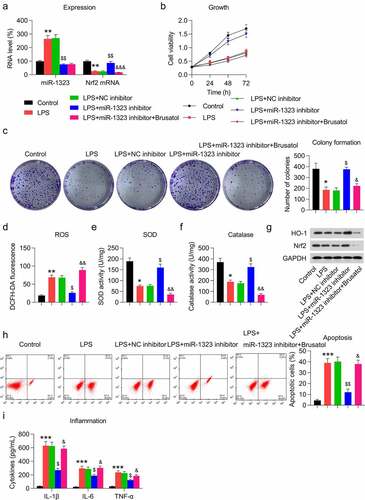
Figure 6. Effect of miR-1323 downregulation and Nrf2 inhibition on growth, oxidative stress, inflammation, and apoptosis of LPS-treated chondrocytes. Chondrocytes were exposed to NC/miR-1323 inhibitor transfection for 24 h, followed by 0.5 μM LPS treatment and 1 μM brusatol treatment for 24 h. (a) The level of miR-1323 and Nrf2 mRNA was analyzed through qRT-PCR. (b) The cell growth rate on days 1, 2, and 3 was determined after transfection through MTT assay. (c) Soft agar CFA of LPS-treated chondrocytes. The colony number is displayed in the right panel. (d) DCFH-DA staining was conducted to evaluate ROS production. (e, f) Activities of the anti-oxidative enzymes SOD and catalase were determined via the corresponding assay kits. (g) WB was used to detect the HO-1 and Nrf2 protein levels in chondrocytes. (h) FC was used for evaluating the apoptotic cell number. The apoptosis rate of LPS-treated chondrocytes is shown in the lower right panel. (i) ELISA was used to analyze the production of pro-inflammatory cytokines in chondrocytes. LPS-treated chondrocytes vs. control group (* P < 0.05, ** P < 0.01, *** P < 0.001); LPS-treated chondrocytes vs. LPS+NC inhibitor group ($ P < 0.05, $$ P < 0.01); LPS-treated chondrocytes vs. LPS+miR-1323 inhibitor group (& P < 0.05, && P < 0.01, &&& P < 0.001).
Supplemental Material
Download Zip (33.7 MB)Data availability statement
The datasets generated during and/or analysed during the current study are available from the corresponding author on reasonable request.