
Figures & data
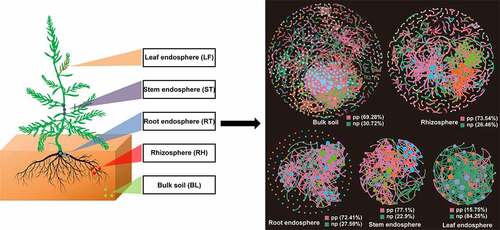
Figure 1. Alpha-diversity indices for the 16S rRNA gene sequence in different samples.
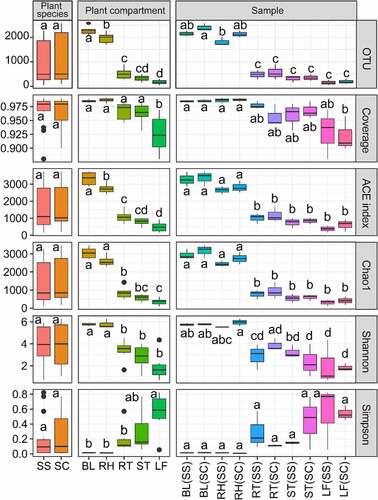
Figure 2. Venn diagram analysis showing the number of unique and shared OTU in different samples. BL(SS), RH(SS), RT(SS), ST(SS) and LF(SS) indicate bulk soil, rhizosphere soil, root, stem and leaf under S. salsa, respectively; BL(SC), RH(SC), RT(SC), ST(SC) and LF(SC) represent bulk soil, rhizosphere soil, root, stem and leaf under S. corniculata, respectively. A: the number of shared and unique OTUs in the different plant compartments of S. salsa species; B: the number of shared and unique OTUs in the different plant compartments of S. corniculata species; C: the relative abundance of shared and unique OTUs.
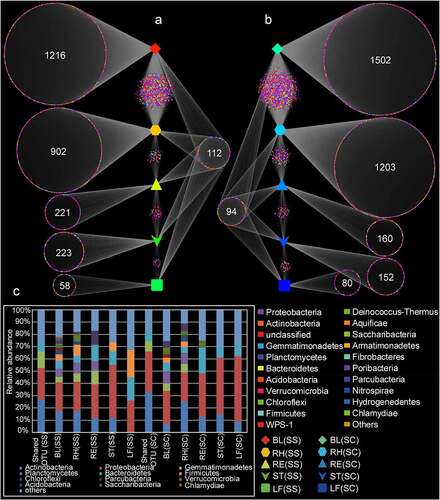
Figure 3. The relative abundance of bacteria at the phylum level in the different samples.
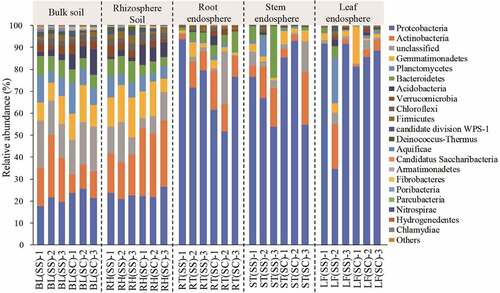
Table 1. Significance tests of the effects of on the bacterial community structure with three different statistical approaches
Figure 4. LEfSe analysis indicating the phylogenetic distribution of microbial lineages associated with the different samples. Differences are represented in the color of the most abundant class. Circles represent phylogenetic levels from domain to genus inside out. RE, root endosphere; RH, rhizosphere; BL, bulk control soil; LF: leaf; RT: root; ST: stem; SS, S. salsa; SC: S. corniculata Bunge.
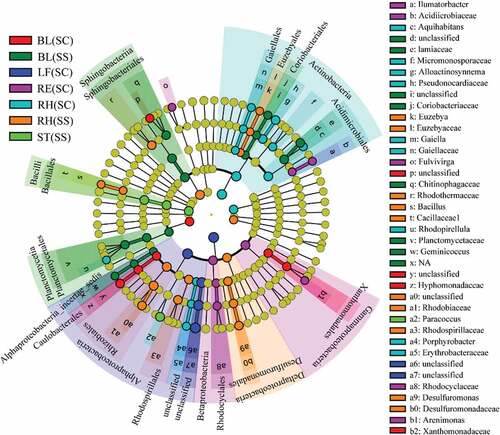
Table 2. Topological properties of molecular ecological networks (MENs) of different Suaeda species and their associated random MENs
Figure 5. Phylogenetic molecular ecological networks based on different Suaeda species microbiomes and the topological roles of nodes. A node represents an OTU, and its color represents its module. The green and red lines indicate negative and positive interaction, respectively. pp: positive interaction; np: negative interaction.
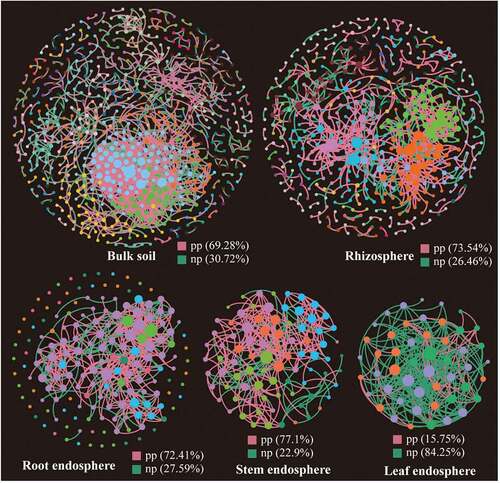
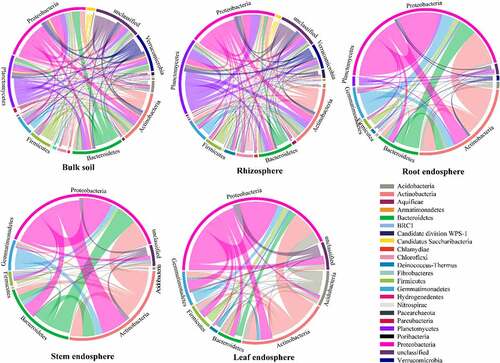
Figure 6. Circos plots showing the distribution of links among interacting phyla in different networks.
Supplemental Material
Download Zip (756.7 KB)Data availability statement
All data included in this study are available upon request by contact with the corresponding author (https://dataview.ncbi.nlm.nih.gov/object/PRJNA593778).