Figures & data

Figure 1. TCF3 is possibly linked to unfavorable prognosis of CC. A, expression of TCF3 in pan cancers; B, expression of TCF3 in GSE7803 and GSE9750 datasets; C, distribution of TCF3 in CC tissues and normal cervical tissues in The Human Protein Atlas system; D, TCF3 expression in TCGA-CESC; E, association of TCF3 expression with the patient survival in TCGA-CESC; F, TCF3 mRNA expression in CC cell lines (CaSki, C-33A, SiHa, SW756 and HeLa) and in normal End1/E6E7 cells detected by RT-qPCR (*p < 0.05; **p < 0.01; one-way ANOVA). Data are expressed as the mean ± SD.
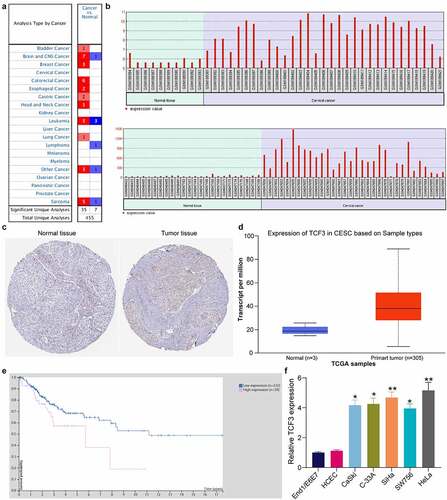
Figure 2. TCF3 downregulation reduces proliferation, migration and invasiveness, and resistance to death of CC cells in vitro. A, TCF3 expression in HeLa and SiHa cells after si-TCF3 transfection detected by RT-qPCR (*p < 0.05, two-way ANOVA); B, proliferation activity of HeLa and SiHa cells examined by colony formation assay (*p < 0.05, two-way ANOVA); C, migration activity of HeLa and SiHa cells measured by Transwell assay (*p < 0.05, two-way ANOVA); D, invasiveness of HeLa and SiHa cells examined by Transwell assay (*p < 0.05, two-way ANOVA); E, HeLa and SiHa apoptosis examined by flow cytometry (*p < 0.05, two-way ANOVA). Data are expressed as the mean ± SD.
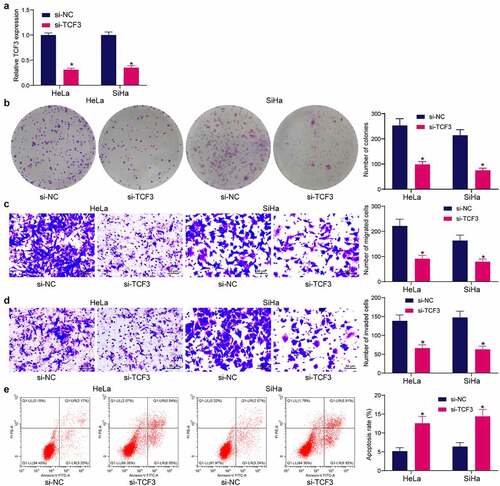
Figure 3. TCF3 plays a transcriptional activation role in CC cells. A, the structural domain of TCF3 determined by protein sequencing; B, construction of pmir-GLO luciferase reporter vectors containing TCF3 and VP16; C, effect of TCF3 on the activity of the luciferase reporter examined by the luciferase assay (*p < 0.05, two-way ANOVA); D, construction of pGLO-TCF3 vector; E, transcriptional regulation activity of TCF3 validated via the luciferase assay (*p < 0.05, unpaired t test). Data are expressed as the mean ± SD.
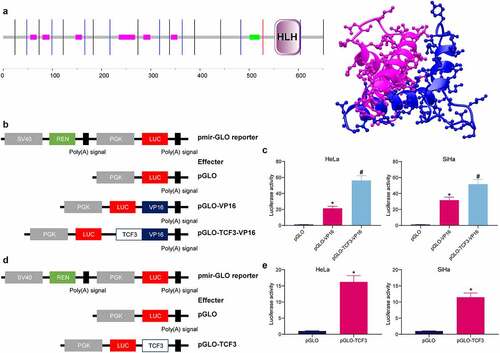
Figure 4. TCF3 binds to the promoter of SIRT1. A, a PPI network of the TCF3-related gene clusters; B, GO and KEGG pathway enrichment analyses of the TCF3-related genes; C, volcano maps for the DEGs in the GSE7803 and GSE9750 datasets; D, a Venn diagram for common DEGs in two datasets; E, GO and KEGG pathway enrichment analyses based on the DEGs; F, putative binding site between TCF3 and the SIRT1 promoter; G, binding between TCF3 and the SIRT1 promoter validated by the ChIP-qPCR assay (*p < 0.05, two-way ANOVA). Data are expressed as the mean ± SD.
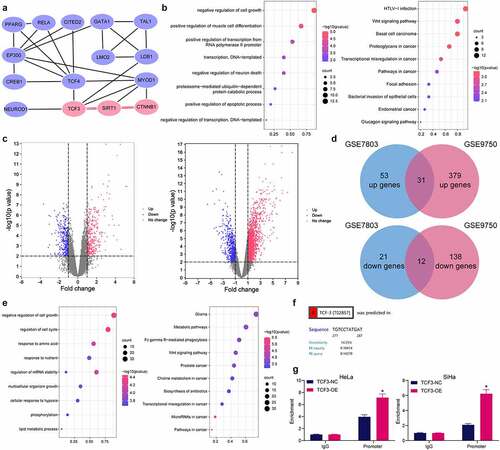
Figure 5. TCF3 binds to SIRT1 to promote β-catenin nuclear accumulation. A, expression of SIRT1 in TCGA-CESC; B, prognostic value of SIRT1 in CC in TCGA-CESC; C, correlation between TCF3 and SIRT1 in CC tumor tissues in TCGA-CESC; D, expression of SIRT1 in CC tissues in GSE7803 and GSE9750 datasets; E, correlation between TCF3 and SIRT1 in CC in GSE7803 and GSE9750 datasets; F, binding relationship between SIRT1 and β-catenin examined by ChIP-qPCR (*p < 0.05, two-way ANOVA); G, acetylation and nuclear accumulation of β-catenin in CC cells (*#p < 0.05, two-way ANOVA; * compared to SIRT1-NC; # compared to DMSO). Data are expressed as the mean ± SD.
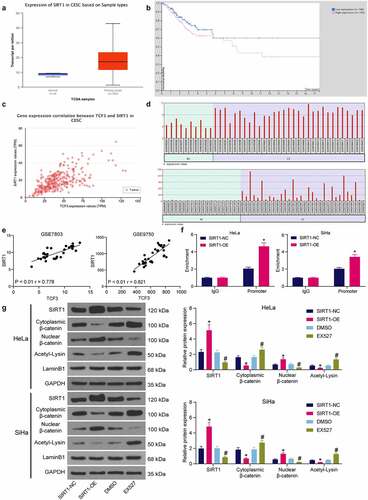
Figure 6. Interactions between TCF3/SIRT1/β-catenin in CC cells. A, SIRT1 expression and β-catenin nuclear accumulation in CC cell lines (CaSki, C-33A, SiHa, SW756 and HeLa) and normal End1/E6E7 cells examined by western blot analysis (*p < 0.05, two-way ANOVA); B, SIRT1 expression and β-catenin nuclear accumulation in HeLa and SiHa cells transfected with si-TCF3 determined by western blot assay (*p < 0.05, two-way ANOVA); C, expression of SIRT1 and nuclear accumulation of β-catenin in HeLa and SiHa cells after SIRT1-OE transfection and XAV-939 treatment examined by western blot assay (*#p < 0.05, two-way ANOVA, * compared to si-TCF3 + SIRT1-NC; # compared to SIRT1-OE + DMSO); D, cell proliferation determined by colony formation assay (*#p < 0.05, two-way ANOVA, * compared to si-TCF3 + SIRT1-NC; # compared to SIRT1-OE + DMSO); E, migration of cells determined by Transwell assay (*#p < 0.05, two-way ANOVA, * compared to si-TCF3 + SIRT1-NC; # compared to SIRT1-OE + DMSO); F, apoptosis rate in HeLa and SiHa cells detected by flow cytometry (*#p < 0.05, two-way ANOVA, * compared to si-TCF3 + SIRT1-NC; # compared to SIRT1-OE + DMSO). Data are expressed as the mean ± SD.
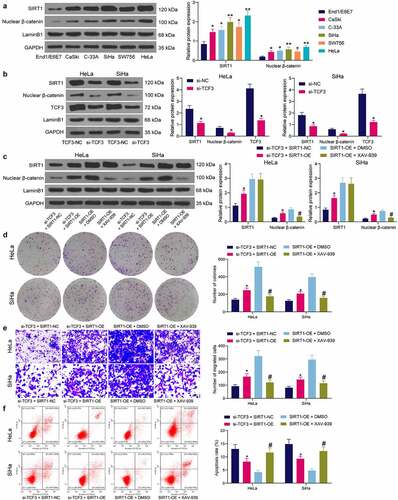
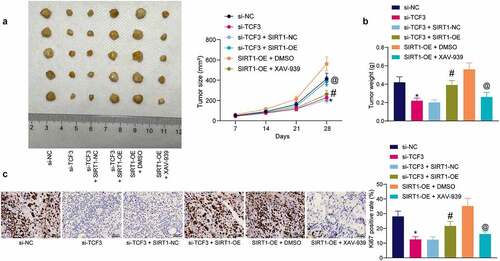
Figure 7. TCF3/SIRT1/β-catenin mediates CC development in vivo. A, growth rate of xenograft tumors induced by HeLa cells in nude mice (*#@p < 0.05, two-way ANOVA; * compared to si-TCF3-NC; # compared to si-TCF3+ SIRT1-NC; @ compared to SIRT1 + DMSO); B, weight of the xenograft tumors on the 28th day (*#@p < 0.05, one-way ANOVA; * compared to si-TCF3; # compared to si-TCF3 + SIRT1-NC; @ compared to SIRT1 + DMSO); C, expression of Ki-67 in xenograft tumors examined by IHC (*#@p < 0.05, one-way ANOVA; * compared to si-TCF3; # compared to si-TCF3+ SIRT1-NC; @ compared to SIRT1 + DMSO). In each group, n = 5. Data are expressed as the mean ± SD.