Figures & data
Table 1. Primer sequences
Figure 1. LINC01123 and IL1R1 are elevated while miR-125a-3p is silenced in LEDVT rats. (a): HE staining assessment of pathological conditions; (b): Masson staining evaluation of pathological conditions; (c-d): Length and weight of thrombus; (e-f): Inflammatory cytokines IL-6 and IL-8 in the serum; (g-h): RT-qPCR or Western Blot examination of LINC01123, miR-125a-3p and IL1R1. Values are expressed as mean ± standard deviation (n = 6). * Vs. the Sham, P < 0.05.
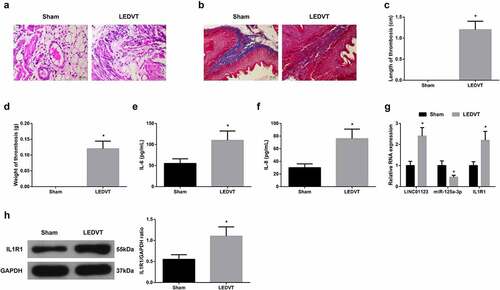
Figure 2. Silence of LINC01123 represses inflammation and thrombosis in LEDVT rats. (a): RT-qPCR test of LINC01123; (b-c): Length and weight of thrombus; (d-e): Inflammatory cytokines IL-6 and IL-8 in the serum; (f): HE staining assessment of pathological conditions; (g): Masson staining evaluation of pathological conditions; Values are expressed as mean ± standard deviation (n = 6). * Vs. the sh-NC, P < 0.05.
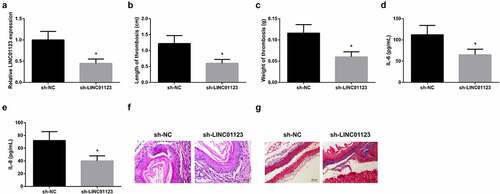
Figure 3. LINC01123 modulates IL1R1 via miR-125a-3p. (a-b): Bioinformation website prediction of the targeted binding site of miR-125a-3p with LINC01123 or IL1R1; (c-d): The luciferase activity assay verification of the targeting of miR-125a-3p with LINC01123 or IL1R1; E-F: RT-qPCR or Western Blot detection of miR-125a-3p with IL1R1. Values are expressed as mean ± standard deviation (n = 6), cell experiments were repeated three times. * Vs. the sh-NC, P < 0.05.
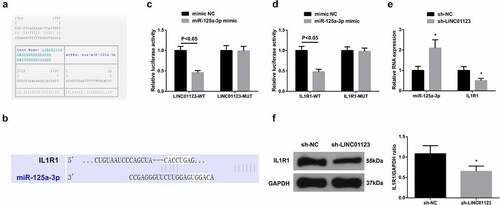
Figure 4. Elevated miR-125a-3p represses inflammation and thrombosis in LEDVT rats. (a): RT-PCR test of miR-125A-3p; (b-c): Length and weight of thrombus; (d-e): Inflammatory cytokines IL-6 and IL-8 in the serum; (f): HE staining assessment of pathological conditions; (g): Masson staining evaluation of pathological conditions; Values are expressed as mean ± standard deviation (n = 6). * Vs. the agomir NC group, P < 0.05.
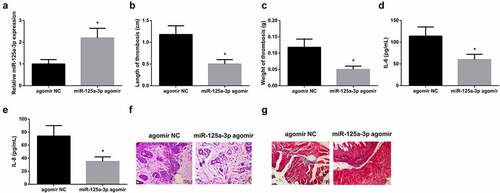
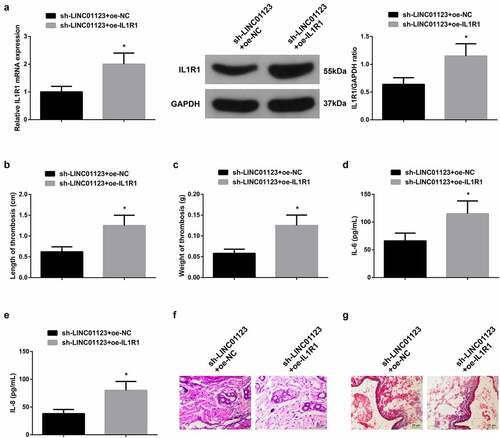
Figure 5. Elevated IL1R1 turns around the action of repressive LINC01123 on LEDVT rats. (a): RT-qPCR and Western Blot verification of successful injection; (b-c): Length and weight of thrombus; (d-e): Inflammatory cytokines IL-6 and IL-8 in the serum; F: HE staining assessment of pathological conditions; (g): Masson staining evaluation of pathological conditions; Values are expressed as mean ± standard deviation (n = 6). * Vs. the sh-LINC01123 + oe-NC, P < 0.05.