Figures & data
Table 1. Relationship between NEAT1 expression and clinicopathologic features of papillary thyroid carcinoma patients
Figure 1. NEAT1 was overexpressed in PTC. (a) NEAT1 level in PTC and normal tissues was examined by qRT-PCR. (b) NEAT1 expression was measured via qRT-PCR in PTC cells (IHH-4, TPC-1, and NIM) and human normal thyroid cells (Nthy-ori 3–1). (c and d) The cellular location of NEAT1 in cytoplasm or nucleus of PTC cells was checked. *P < 0.05.
Figure 2. NEAT1 knockdown inhibited PTC cell malignant behaviors. PTC cells (TPC-1 and NIM cells) were transfected with or without si-NC or si-NEAT1. (a) NEAT1 expression was measured by qRT-PCR in PTC cells. (b and c) MTT assay was used for measuring cell viability. (d) The apoptosis rate was assessed through flow cytometry in PTC cells. (e) Transwell assay was applied for evaluating the invasion ability in PTC cells. (f and g) The protein expression of CyclinD1, Bax, and MMP9 were detected by western blot in PTC cells. *P < 0.05.
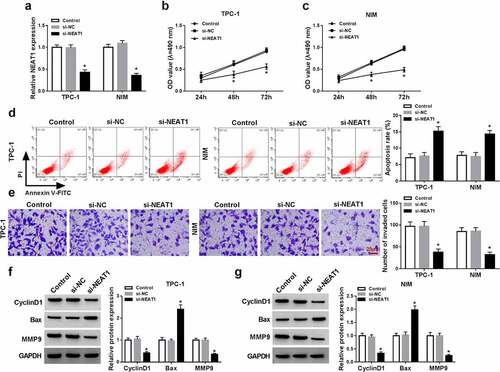
Figure 3. NEAT1 sponged miR-524-5p. (a) Binding region between miR-524-5p and NEAT1 was predicted by Starbase 2.0. (b and c) The interaction between miR-524-5p and NEAT1 was further verified by dual-luciferase reporter system. (d) The effects of NEAT1 silencing or upregulating on miR-524-5p expression were assessed by qRT-PCR in PTC cells. (e and f) MiR-524-5p expression in PTC or corresponding normal tissues and cells was measured by qRT-PCR. (g) The correlation between the expression of miR-524-5 and NEAT1 was analyzed by Pearson correlation analysis. (h–k) The viability, apoptosis and invasion were assessed via MTT assay, flow cytometry and transwell assay in PTC cells transfected with si-NEAT1 + anti-miR-524-5p or negative control. (l and m) The protein expression levels of CyclinD1, MMP9 and Bax which were the representative markers for proliferation, metastasis and apoptosis were detected by western blot. *P < 0.05.
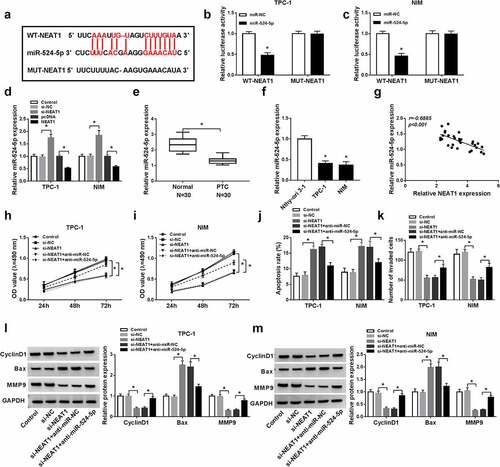
Figure 4. MiR-524-5p targeted ID1 3ʹUTR. (a) The sequence of ID1 3ʹUTR containing the binding sites for miR-524-5p was exhibited. (b and c) The interaction luciferase between miR-524-5p and ID1 was verified using dual-luciferase reporter assay. (d and e) The mRNA and protein of ID1 levels in PTC and normal tissues were detected by qRT-PCR and western blot. (f and g) The mRNA and protein of ID1 levels in PTC cells (IHH-4, TPC-1 and NIM) and human normal thyroid cells (Nthy-ori 3–1) were detected by qRT-PCR and western blot. (h) The correlation between ID1 and miR-54-5p was presented by Pearson correlation coefficient. (i–l) ID1 mRNA and protein levels were measured in TPC-1 and NIM cells after transfection with miR-NC, miR-524-5p, anti-miR-NC, or anti-miR-524-5p by qRT-PCR and western blot. *P < 0.05.
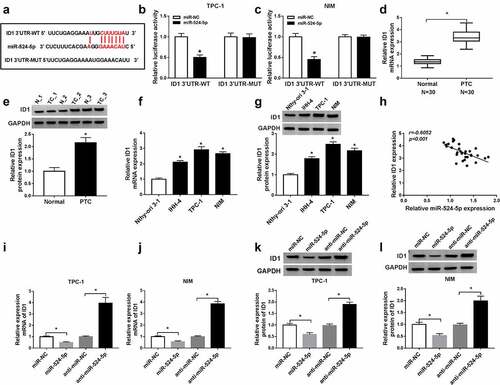
Figure 5. ID1 counteracted the inhibitory impacts of miR-524-5p on cell proliferation, invasion, and the promotion impact on apoptosis in TPC-1 and NIM cells. The TPC-1 and NIM cells were transfected with control, miR-NC, miR-524-5p, miR-524-5p + pcDNA or miR-524-5p + ID1. (a–d) Cell viability, apoptosis rate, and invasive ability were detected. (e and f) CyclinD1, Bax, and MMP9 protein levels were detected by western blot in PTC cells. *P < 0.05.
Figure 6. NEAT1 sponged positively miR-524-5p to regulate ID1 expression. The TPC-1 and NIM cells were transfected with control, miR-NC, miR-524-5p, miR-524-5p + pcDNA or miR-524-5p + NEAT1. (a and b) The protein level of ID1 was detected by western blot. *P < 0.05.
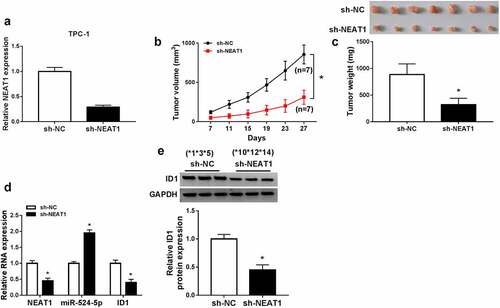
Figure 7. NEAT1 knockdown suppressed xenograft tumor growth in vivo. (a) The expression of NEAT1 in TPC-1 cells with sh-NC or sh-NEAT1 transfection. (b and c) The tumor volume and weight were shown. (d) The expression levels of NEAT1, miR-524-5p and ID1 mRNA were detected. (e) The protein expression of ID1 was measured via western blot. *P < 0.05.