
Figures & data
Figure 1. Characterization of TDSCs. (a) Morphology of TDSCs and the potential of multilineage differentiation of TDSCs. (b) Surface markers including CD90, CD105, CD44, CD106 and CD11B measured by flow cytometry assay.
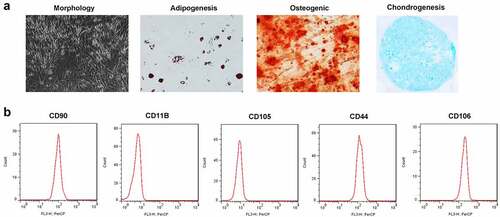
Figure 2. MALAT1 was significantly up-regulated in the TGFβ1-treated TDSCs. (a) Sirius Red staining of TDSCs treated with TGFβ1 on day 0, 3, 7, 10. (b) RT-qPCR was conducted to measure the MALAT1 expression on day 0, 3, 7, 10. *P < 0.05, **P < 0.01, ***P < 0.001.
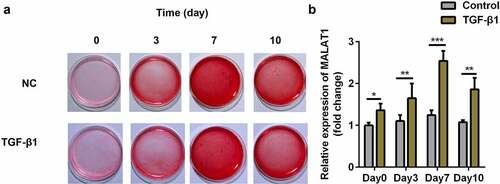
Figure 3. Knockdown of MALAT1 suppressed the tenogenic differentiation. (a) Transfection efficiency of si-MALAT1. (b, c) Sirius Red staining and OD value measurement of TDSCs on day 7. d-i RT-qPCR was conducted to measure the expressions of SCX, Mkx, COL1a1, Fmod, Mmp3 and Thbs4. *P < 0.05, **P < 0.01, ***P < 0.001.
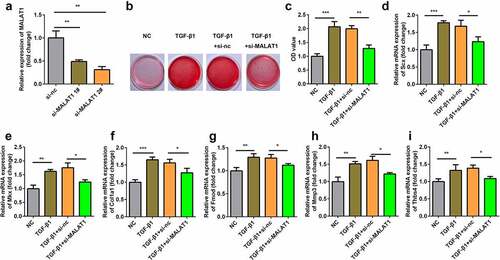
Figure 4. MALAT1 functioned as the sponge of miR-378a-3p. (a) Bioinformatic prediction of binding site of miR-378a-3p by MALAT1. (b) Relative luciferase activity of cells after co-transfection with wild type (WT) or mutant (Mut) lncRNA MALAT1 3’-UTR reporter genes and miR-378a-3p mimics. (c) RT-qPCR was conducted to measure the relative expression of miR-378a-3p after si-MALAT1 and oe-MALAT1 transfection. (d) RT-qPCR was conducted to measure the relative expression of miR-378a-3p in the TGFβ1-treated TDSCs. ***P < 0.001.
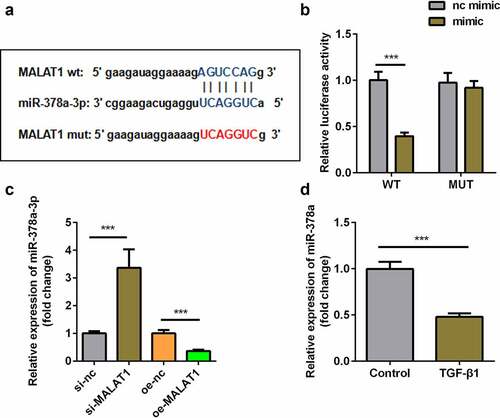
Figure 5. Knockdown of miR-378a-3p reversed the effect of si-MALAT1. (a) Transfection efficiency of si-MALAT1 miR-378a-3p inhibitor. (b, c) Sirius Red staining and OD value measurement of TDSCs on day 7 after si-MALAT1 and miR-378a-3p inhibitor transfection. (d-i) RT-qPCR was conducted to measure the expressions of SCX, Mkx, COL1a1, Fmod, Mmp3 and Thbs4 after si-MALAT1 and miR-378a-3p inhibitor transfection. *P < 0.05, **P < 0.01, ***P < 0.001.
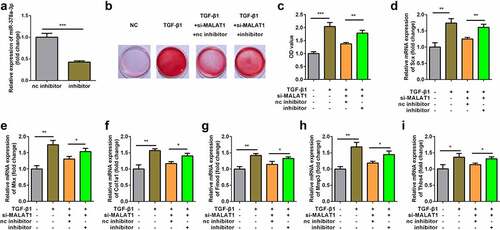
Figure 6. Interaction between miR-378a-3p and MAPK1. (a) Bioinformatic prediction of binding site of miR-378a-3p by MAPK1. (b) Relative luciferase activity of cells after co-transfection with wild type (WT) or mutant (Mut) MAPK1 3’-UTR reporter genes and miR-378a-3p mimics. RT-qPCR (c) and western blot (d) was conducted to measure the relative expression of MAPK1 after miR-378a-3p mimic and inhibitor transfection. (eS) RT-qPCR was conducted to measure the relative expression of MAPK1 in the TGFβ1-treated TDSCs. ***P < 0.001.
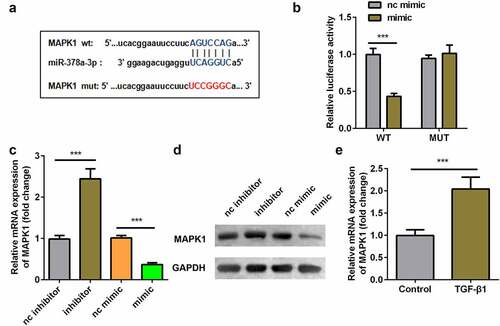
Figure 7. Overexpression of MAPK1 reversed the effect of miR-378a-3p mimic. (a-b) Transfection efficiency of MAPK1 vector. (c-d) Sirius Red staining and OD value measurement of TDSCs on day 7 after miR-378a-3p mimic and MAPK1 vector transfection. (e-j) RT-qPCR was conducted to measure the expressions of SCX, Mkx, COL1a1, Fmod, Mmp3 and Thbs4 after miR-378a-3p mimic and MAPK1 vector transfection. *P < 0.05, **P < 0.01, ***P < 0.001.
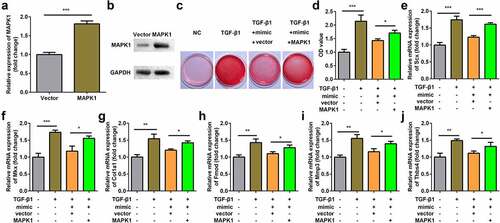
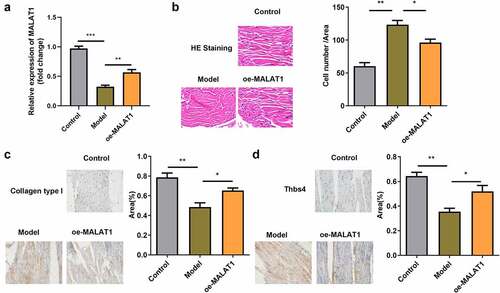
Figure 8. Overexpression of MALAT1 relieve the impaired tendon tissues in the rats. (a) RT-qPCR were conducted to measure the MALAT1 expression. (b) HE staining of the tendon defect in the rats. (c-d) immunohistochemistry staining (Collagen type 1 and Thbs4) of tendon defect in the rats. *P < 0.05, **P < 0.01.
Data Availability Statement
The datasets used and analyzed during the current study are available from the corresponding author on reasonable request.