Figures & data
Table 1. Primer sequences
Figure 1. LINC00616 was highly expressed in LPS-PG-treated PDLSCs with ferroptosis. (a) Expression of 10 lncRNAs in PDLSCs before and after LPS-PG treatment measured with qRT-PCR. (b) qRT-PCR analyses of LINC00616 expression in patients with periodontitis. (c) qRT-PCR analyses of LINC00616 expression in PDLSCs. (d-g) Levels of ROS, Fe2+, GSH, and MDA in PDLSCs.
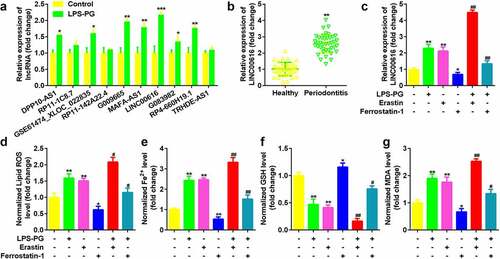
Figure 2. Knockdown of LINC00616 promoted cell viability and inhibited ferroptosis of PDLSCs. (a) LINC00616 expression levels were detected by qRT-PCR in PDLSCs after transfection. (b) Cell viability is measured using an MTT assay after transfection in PDLSCs treated with LPS-PG. (c-f) Levels of ROS, Fe2+, GSH, and MDA in PDLSCs treated with LPS-PG after transfection. (g) Images and quantized bar chart of TUNEL stained cells. (h) Expression of GPX4, SLC7A11, and ACSL4 proteins detected by western blotting.
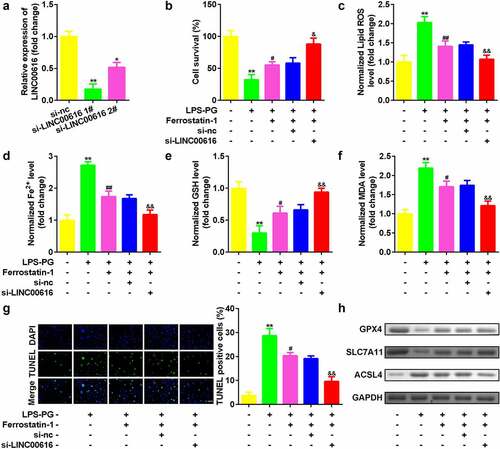
Figure 3. LINC00616 sponged miR-370 in PDLSCs. (a) The binding sites between miR-370 and LINC00616 are predicted by StarBase. (b) The dual luciferase reporter assay confirmed that miR-370 is a target of LINC00616 in PDLSCs. (c-e) qRT-PCR analysis for miR-370 expression in periodontal ligament tissues and PDLSCs.
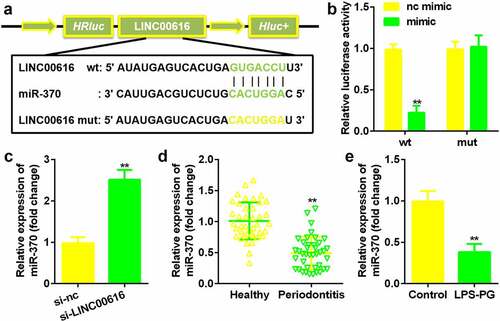
Figure 4. Suppression of miR-370 reversed the effects of LINC00616 on cell viability, and ferroptosis in PDLSCs treated with LPS-PG. (a) qRT-PCR analyses of miR-370 expression levels. (b) Cell viability is measured using an MTT assay after cotransfection in LPS-PG treated PDLSCs. (c-f) Levels of ROS, Fe2+, GSH, and MDA in PDLSCs treated with LPS-PG after cotransfection. (g) Images and quantized bar chart of TUNEL stained cells. (h) Expression of GPX4, SLC7A11, and ACSL4 proteins detected by western blotting.
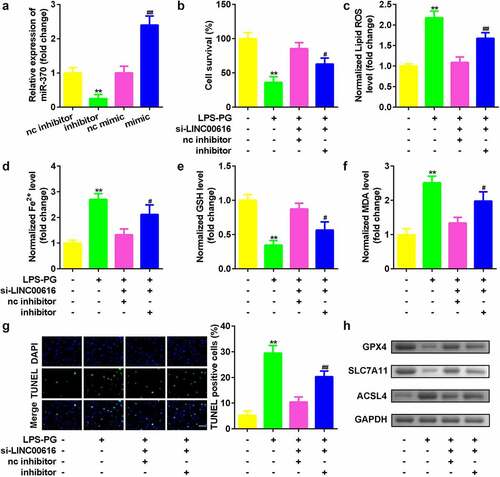
Figure 5. TFRC was the target gene for miR-370. (a) Bioinformatics predicted the binding sites between miR-370 and TFRC. (b) A dual-luciferase reporter assay was performed to confirm the association between TFRC and miR-370. (c-e) qRT-PCR analysis for the expression of TFRC in periodontal ligament tissues and PDLSCs.
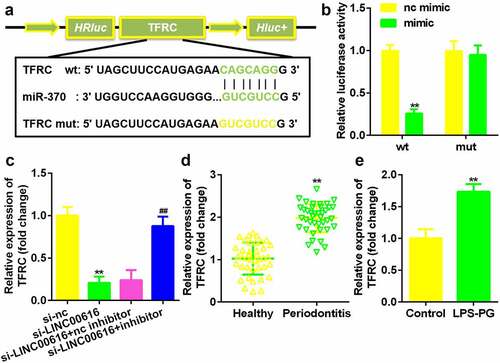
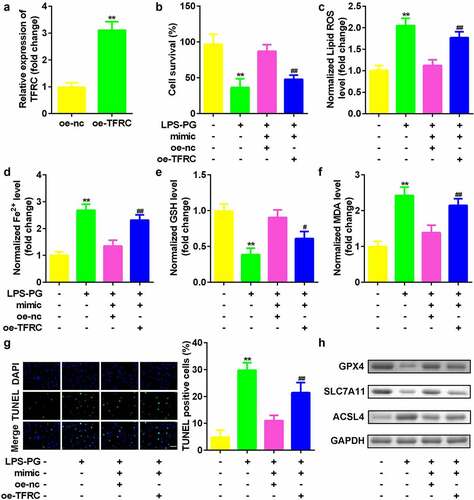
Figure 6. Upregulated TFRC inhibited the effects of downregulated miR-370. (a) qRT-PCR analyses of TFRC expression levels. (b) Cell viability is measured using an MTT assay after cotransfection in PDLSCs treated with LPS-PG. (c-f) Levels of ROS, Fe2+, GSH, and MDA in PDLSCs treated with LPS-PG after cotransfection. (g) Images and quantized bar chart of TUNEL stained cells. (h) Expression of GPX4, SLC7A11, and ACSL4 proteins detected by western blotting.