Figures & data
Figure 1. Successful establishment of a GDM mouse model. (a-c), HOTTIP, miR-423-5p and WNT7A levels in liver tissues of mice were detected by RT-qPCR; (d), the WNT7A protein expression was examined by Western blot analysis; e, the expression of GLUT-2, PEPCK and G-6-Pase in liver tissues of mice was assessed by RT-qPCR; f-i, the levels of serum biochemical indices FBG, FINS, TC and TG as well as mice weight were detected; (j-l), HOMA-IRI, HOMA-β% and HOMA-ISI levels were assessed by HOMA; (m), the pathological change of pancreatic cells was examined by HE staining; (n), the apoptosis rate of pancreatic cells was detected by TUNEL staining. The data in the figure were all measurement data and the expressed as mean value ± standard derivation; n = 6 mice; * P < 0.05 vs. the Control group.
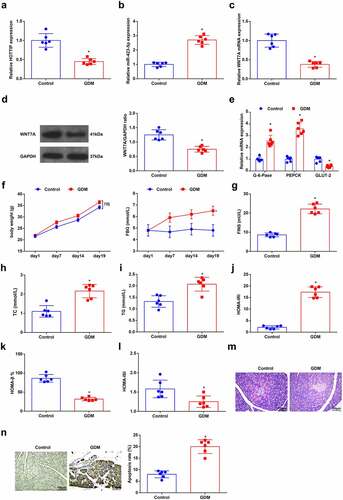
Figure 2. HOTTIP overexpression improves insulin resistance and hepatic gluconeogenesis in GDM mice. (a), the expression of HOTTIP in liver tissues of mice after the up-regulation of HOTTIP was detected by RT-qPCR; (b), GLUT-2, PEPCK and G-6-Pase levels in liver tissues of mice after the up-regulation of HOTTIP were detected by RT-qPCR; (c-f), mice weight and the levels of serum biochemical indices FBG, FINS, TC and TG were determined after the up-regulation of HOTTIP; g-i, HOMA-IRI, HOMA-β% and HOMA-ISI levels after the up-regulation of HOTTIP were assessed in HOMA; (j), the pathological change of pancreatic cells after the up-regulation of HOTTIP was examined by HE staining; (k), the apoptosis rate of pancreatic cells after the up-regulation of HOTTIP was detected by TUNEL staining. The data in the figure were all measurement data and the expressed as mean value ± standard derivation; n = 6 mice; * P < 0.05 vs. the GDM + oe-NC group.
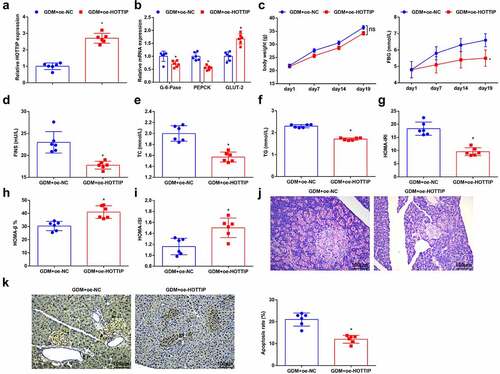
Figure 3. HOTTIP binds to miR-423-5p. (a). the binding relationship between HOTTIP and miR-423-5p was predicated through the bioinformatic website DIANA; B, the binding relationship between HOTTIP and miR-423-5p was validated by dual luciferase reporter gene assay; (c), relative HOTTIP level was detected by RIP experiment; (d), miR-423-5p expression in mouse liver tissues after the up-regulation of was HOTTIP was examined by RT-qPCR. The data in the figure were all measurement data and the expressed as mean value ± standard derivation; (b-c): cell experiments were repeated three times; (d): n = 6 mice; * P < 0.05 vs. the mimic NC group; # P < 0.05 vs. the GDM + oe-NC group.
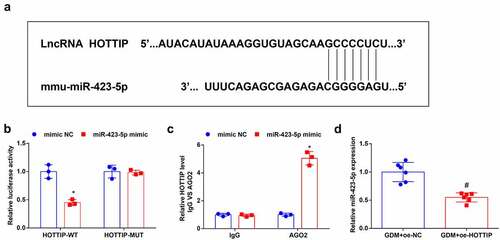
Figure 4. Down-regulation of miR-423-5p alleviates insulin resistance and hepatic gluconeogenesis in GDM mice. (a), miR-423-5p level in liver tissues of mice after the down-regulation of miR-423-5p was detected by RT-qPCR; (b), the levels of GLUT-2, PEPCK and G-6-Pase in liver tissues of mice after the down-regulation of miR-423-5p were detected by RT-qPCR; (c-f), mice weight and serum biochemical indices FBG, FINS, TC and TG levels were examined after the down-regulation of miR-423-5p; (g-i), HOMA-IRI, HOMA-β% and HOMA-ISI levels after the the down-regulation of miR-423-5p were assessed by HOMA; (j), the pathological change of pancreatic cells after the down-regulation of miR-423-5p was examined by HE staining; (k), the apoptosis rate of pancreatic cells after the down-regulation of miR-423-5p was detected by TUNEL staining. The data in the figure were all measurement data and the expressed as mean value ± standard derivation; n = 6 mice; * P < 0.05 vs. the GDM + antagomiR NC group.
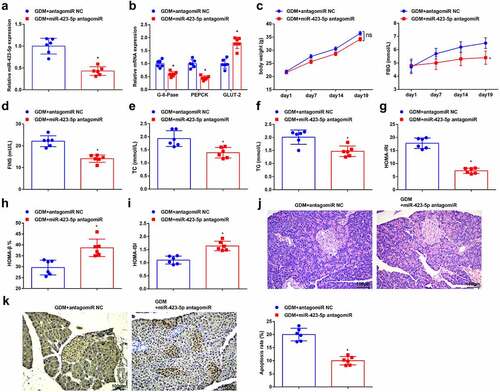
Figure 5. MiR-423-5p targets WNT7A. (a), the binding sites between miR-423-5p and WNT7A were predicated through the bioinformatic website TargetScan; b, the targeting relationship between miR-423-5p and WNT7A was detected by the dual luciferase gene reporter gene assay; (c), WNT7A level after transfected with miR-423-5p mimic was detected in RIP experiment; (d/e), WNT7A expression level in mouse liver tissues after the down-regulation of miR-423-5p was detected by RT-qPCR and Western blot analysis. The data in the figure were all measurement data and the expressed as mean value ± standard derivation; (b-c): cell experiments were repeated three times; (d-e): n = 6 mice; * P < 0.05 vs. the mimic NC group; # P < 0.05 vs. the GDM + antagomiR NC group.
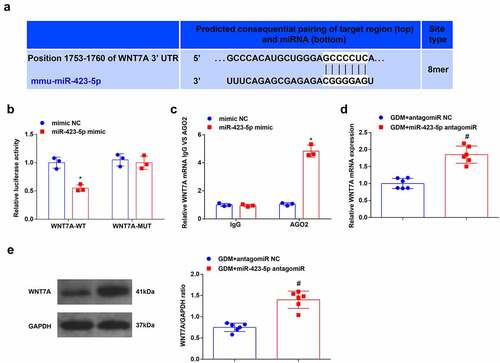
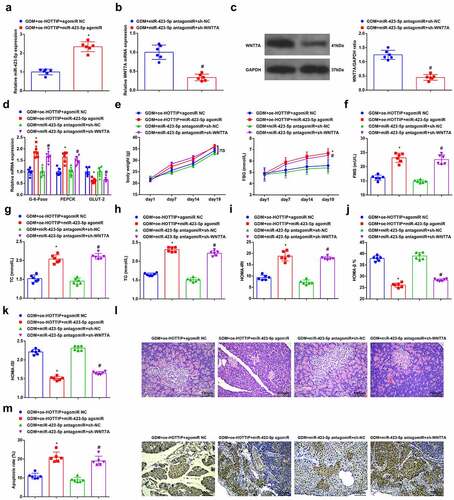
Figure 6. Up-regulated HOTTIP attenuates GDM via the miR-423-5p/WNT7A axis. (a), miR-423-5p level in liver tissues of mice after give injection of saline with dissolved oe-HOTTIP and miR-423-5p agomiR was detected by RT-qPCR; (b/c), WNT7A expression in liver tissues of mice after given injection of saline with dissolved miR-423-5p antagomiR and sh-WNT7A was examined by RT-qPCR and Western blot analysis; (d), the level of GLUT-2, PEPCK and G-6-Pase in liver tissues of mice after give injection of saline with dissolved oe-HOTTIP + miR-423-5p agomiR or miR-423-5p antagomiR + sh-WNT7A was detected by RT-qPCR; (e-h), mice weight and serum biochemical indices FBG, FINS, TC and TG levels were examined after give injection of saline with dissolved oe-HOTTIP + miR-423-5p agomiR or miR-423-5p antagomiR + sh-WNT7A were examined; i-k, HOMA-IRI, HOMA-β% and HOMA-ISI levels after give injection of saline with dissolved oe-HOTTIP + miR-423-5p agomiR or miR-423-5p antagomiR + sh-WNT7A were assessed by HOMA; (l), the pathological change of pancreatic cells after give injection of saline with dissolved oe-HOTTIP + miR-423-5p agomiR or miR-423-5p antagomiR + sh-WNT7A was examined by HE staining; (m), the apoptosis rate of pancreatic cells after give injection of saline with dissolved oe-HOTTIP + miR-423-5p agomiR or miR-423-5p antagomiR + sh-WNT7A was detected by TUNEL staining. The data in the figure were all measurement data and the expressed as mean value ± standard derivation. n = 6 mice; * P < 0.05 vs. the GDM + oe-HOTTIP + agomiRNC group; # P < 0.05 vs. the GDM + miR-423-5p antagomiR + sh-NC group.