Figures & data
Table 1. List of primer sequences used for real-time PCR.
Figure 1. Effects of PNB on tumor growth in SCC-7 tumor-bearing mice. (a) Overview of the experimental protocol of SCC-7 tumor-bearing mice that orally inoculated with PNB. Antibiotic treatments were represented by the yellow squares, and orally inoculated with PNB was represented by the blue squares. (b) Tumor volumes measured at the end of the experiment. (c) Tumor weights detected at the end of the experiment. (d) Gross appearance of tumors. (e) Representative immunohistochemical staining for Cyclin D1 in tumor tissues (high positive cells were indicated by the black arrows). Scale bars, 50 μm. (f) Alveolar bone loss was shown by the red areas in three-digital reconstructions (3D) and the distances between two horizontal lines (blue and red) in sagittal slice views (2D). Scale bars, 1 mm. Control, SCC-7 tumor-bearing mice that orally inoculated with CMC (n = 5); P-, SCC-7 tumor-bearing mice that orally inoculated with PNB (n = 5). Data were represented as means ± SEM. *p < 0.05.
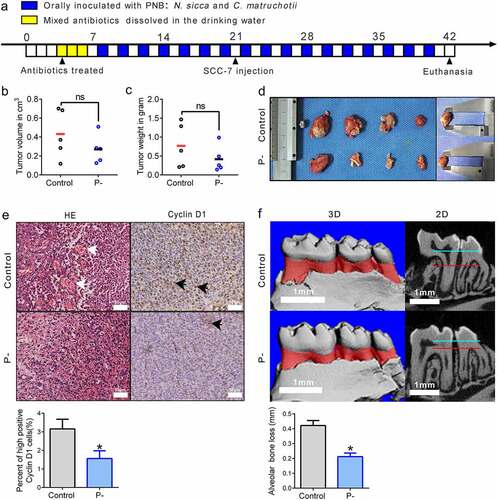
Figure 2. ATR-CHK1 signaling was activated by PNB in SCC-7 tumors. (a) Representative immunohistochemical staining for γ-H2AX in tumor tissues (high positive cells were indicated by the black arrows). Scale bars, 50 μm. (b) Proteins of DNA damage repair signaling. α-Tubulin was used as a loading control. Western blot bands were quantified. (c) Histogram of the relative mRNA (fold change) expression level of genes involved in DNA damage repair signaling. Data were representative of three independent experiments. Data were represented as means ± SEM. *p < 0.05, **p < 0.01.
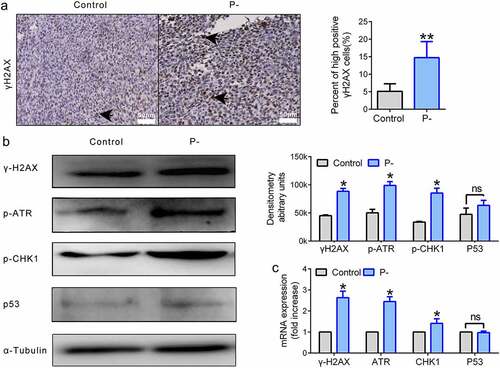
Figure 3. NLRP3/GSDMD-mediated pyroptosis was upregulated by PNB in tumors. (a) Representative immunohistochemical staining for NLRP3 and GSDMD in tumor tissues (positive cells were indicated by the black arrows). Scale bars, 75 μm. (b) Histogram of the relative mRNA (fold change) expression levels of NLRP3 inflammasomes factors. Data were representative of three independent experiments. Data were represented as means ± SEM. *p < 0.05, **p < 0.01.
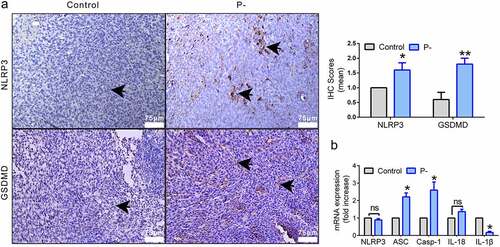
Figure 4. The inflammation level was suppressed in tumors and spleens by PNB. (a) Representative immunohistochemical staining for CD4+ and CD8+ T cells, and immunofluorescence staining for CD206+ cells. Positive expression cells were indicated by the white arrows. White pulp (W) and red pulp (R) of the spleen were shown. Scale bars, 100 μm. (b) Histograms showing the mean IHC scores for CD4+ and CD8+ T cells (left) of images shown in panel A and the % of IF scores for CD206+ cells (right) of images shown in panel A. (c) Histogram of the relative mRNA (fold change) expression level of pro-inflammatory factors in the tumors. Data were represented as means ± SEM. *p < 0.05.
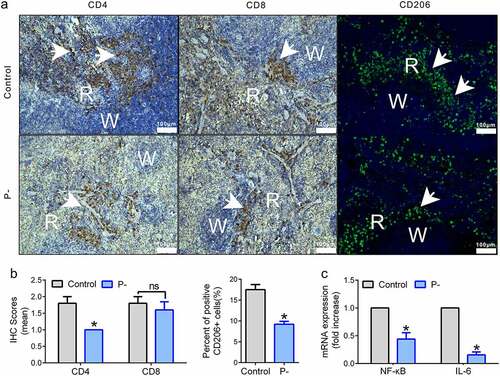
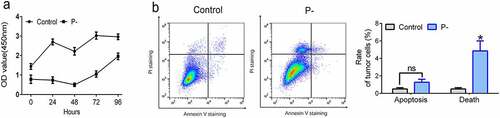
Figure 5. The growth of HSC-3 cells was inhibited by PNB in vitro. (a) The viability of HSC-3 cells with 8 h post-infection was determined using the CCK-8 assay at 24, 48, 72, and 96 h. (b) HSC-3 cells with 24 h post-infection stained with Annexin V-FITC/PI were analyzed by flow cytometry. Dead cells were represented by the Annexin V-FITC negative and PI positive, while apoptotic cells were represented by the Annexin V-FITC positive. Control, HSC-3 cells were co-cultured with PBS; P-, HSC-3 cells were co-infected with PNB. Data were means ± SEM. *p < 0.05. Results were representative of three independent experiments.