Figures & data
Figure 1. SHP-1, c-Src, p-c-Src, and Cx43 expression after overexpression of SHP-1 was detected by qPCR and western blot. (a) qPCR was used to detect the gene expression of SHP-1 and Cx43 in HL-1 cells. (b) The expression of SHP-1, c-Src, p-c-Src, and Cx43 in HL-1 cells was detected by WB, and semi-quantitative analysis based on gray value was performed. OE-SHP-1, HL-1 cells transfected with SHP-1 overexpression lentivirus. NC, HL-1 cells transfected with lentivirus vector. ##, p < 0.01.
Figure 2. The protein expression after overexpression of SHP-1 was detected by immunofluorescence. (a) The microscopy images of SHP-1, p-c-Src, and Cx43 stained in HL-1 cells were photographed under a fluorescence microscope. (b) The average fluorescence intensity was calculated. OE-SHP-1, HL-1 cells transfected with SHP-1 overexpression lentivirus. NC, HL-1 cells transfected with lentivirus vector. ##, p < 0.01. Scale bar: 50 μm.
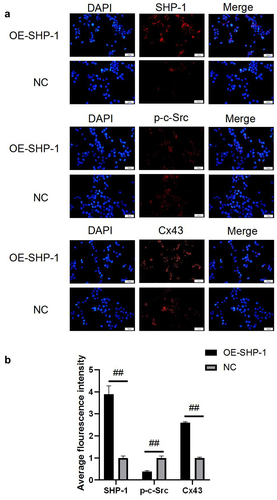
Figure 3. SHP-1 is directly combined with c-Src. (a) The immunofluorescence co-localization of SHP-1 and c-Src protein in HL-1 cells. Scale bar: 50 μm. (b) Co-IP test was performed with SHP-1 antibody and cell extract co-precipitated IgG polyclonal antibody was used as control, and the cell extract was set as an input. (c) Co-IP test was performed with c-Src antibody and cell extract co-precipitated IgG polyclonal antibody was used as control, and the cell extract was set as an input.
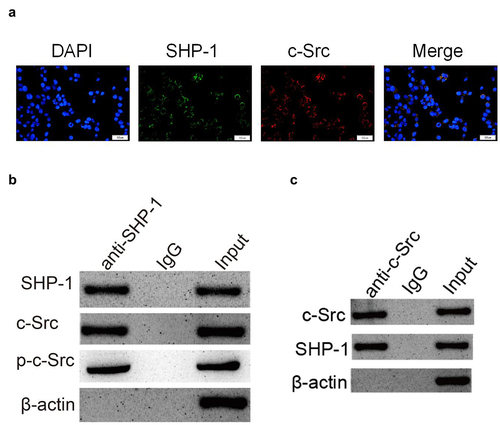
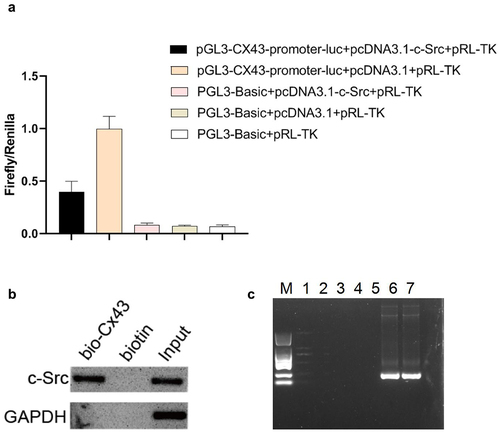
Figure 4. C-Src binds to the promoter region of Cx43 to inhibit its transcription. (a) The double-luciferase reporter system was used to detect the regulation of c-Src on Cx43 promoter. (b) The binding of c-Src and Cx43 DNA was detected by DNA pull down. (c) The binding effect of c-Src and Cx43 DNA was detected by chip. M, DL2000 marker; 1–5, negative primers; 6–7, positive primers.