
Figures & data
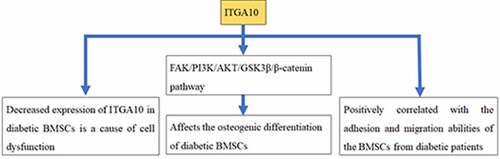
Table 1. Sequences of the primers used for real-time RT-PCR
Figure 1. Comparison of biological functions of BMSCs from the DM-F, DM-S, and Nor groups. (a, c) The adhesion ability of BMSCs was significantly lower in the DM-F group than in the DM-S and Nor groups. (b, d) The migration ability of BMSCs in the DM-F group was lower than that in the DM-S group and much lower than that in the Nor group. (e) The results of the ALP staining and activity assay showed that the osteogenic differentiation ability of BMSCs in the DM-F group was lower than that in the DM-S group and much lower than that in the Nor group. (f) Alizarin red staining and quantitative results showed a trend similar to that of the ALP results. (g) The mRNA expression levels of COL1A1, OCN, and BSP in BMSCs were also significantly lower in the DM-F group. The results are expressed as the mean ± standard deviation. *P < 0.05; **P < 0.01.
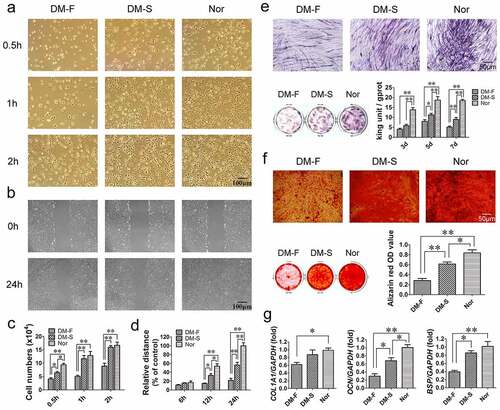
Table 2. Top 10 significantly differentially expressed proteins in the DM-F group/DM-S group
Figure 2. Proteomics-based bioinformatics analysis results. (a) GO annotation showed the biological processes, cellular components, and molecular functions of differentially expressed proteins in BMSCs from the DM-F and DM-S groups. (b) Random forest analysis showed that the Mean Decrease Gini coefficient of ITGA10 was 9.05, ranking fifth among all differentially expressed proteins, and the multidimensional scaling plots showed good intragroup similarity in the DM-F group and the DM-S group. (c) KEGG analysis showed significant differences in integrin function-related signaling pathways between the above two groups. (d) Diagram of the focal adhesion signaling pathway showed the relations of ECM/ITG/FAK/PI3K/AKT/GSK3β/β-catenin. (e) Protein-protein interaction analysis of differentially expressed proteins showed strong correlations between ITGA10 and COL16A1, ITGA10 and COL4A1, and ITGA10 and ITGB3. (f, g) Real-time RT-PCR and western blot results confirmed that ITGA10 expression was significantly lower in the DM-F group than in the DM-S group, and ITGA10 expression in both of these groups was lower than that in the Nor group. The results are expressed as the mean ± standard deviation. *P < 0.05; **P < 0.01.
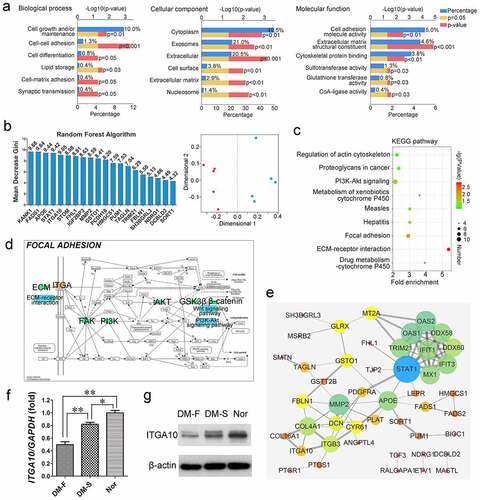
Figure 3. The inhibitory effect of ITGA10 knockdown on the adhesion and migration abilities of BMSCs. (a) Real-time RT-PCR and western blotting confirmed the knockdown efficiency. (b-d) ITGA10 knockdown significantly decreased the adhesion ability of BMSCs from T2DM patients. (e, h) ITGA10 knockdown significantly reduced the spreading area of BMSCs from T2DM patients. (f, g, i, j) Scratch and transwell assays showed that ITGA10 knockdown significantly reduced the migration ability of BMSCs from T2DM patients. The results are expressed as the mean ± standard deviation. *P < 0.05; **P < 0.01.
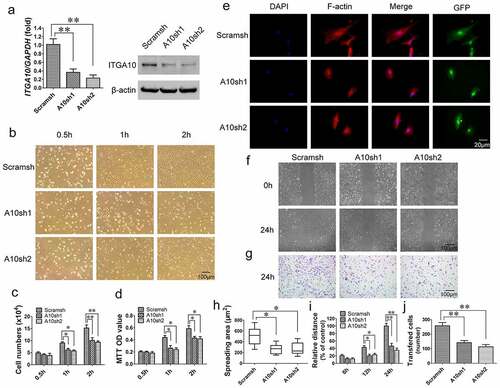
Figure 4. The inhibitory effect of ITGA10 knockdown on the osteogenic differentiation potential of BMSCs. (a) Western blot results showed that ITGA10 knockdown downregulated the FAK/PI3K/AKT/GSK3β/β-catenin signaling pathway. (b) After ITGA10 knockdown, BMSCs from T2DM patients exhibited significantly decreased ALP expression and activity. (c) After ITGA10 knockdown, the mineralization ability of BMSCs from T2DM patients was also significantly decreased. (d) ITGA10 knockdown resulted in significant decreases in COL1A1 and BSP mRNA expression in BMSCs from T2DM patients after 7 days of osteogenic induction; after 14 days, the mRNA expression levels of COL1A1, OCN, and BSP were all significantly decreased. The results are expressed as the mean ± standard deviation. *P < 0.05; **P < 0.01.
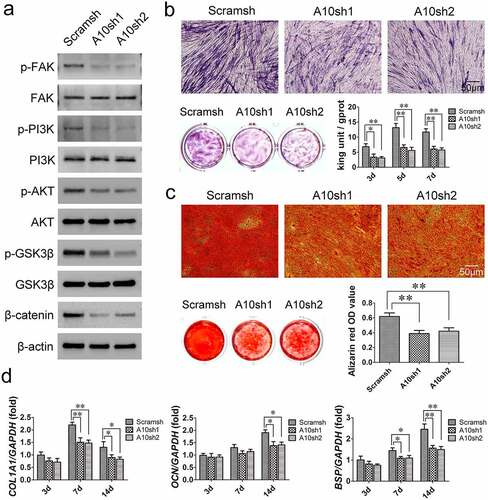
Figure 5. The enhancement effect of ITGA10 overexpression on the adhesion and migration abilities of BMSCs. (a) Real-time RT-PCR and western blotting confirmed the overexpression efficiency. (b-d) ITGA10 overexpression significantly increased the adhesion ability of BMSCs from T2DM patients, whereas the FAK inhibitor PF573228 significantly inhibited this effect. (e, h) ITGA10 overexpression led to a slight increase in the spreading area of BMSCs from T2DM patients, whereas PF573228 significantly reduced the spreading ability of these BMSCs. (f, g, i, j) Scratch and transwell assays showed that ITGA10 overexpression significantly increased the migration ability of BMSCs from T2DM patients, but PF573228 significantly reduced this effect. The results are expressed as the mean ± standard deviation. PF represents PF573228. *P < 0.05; **P < 0.01.
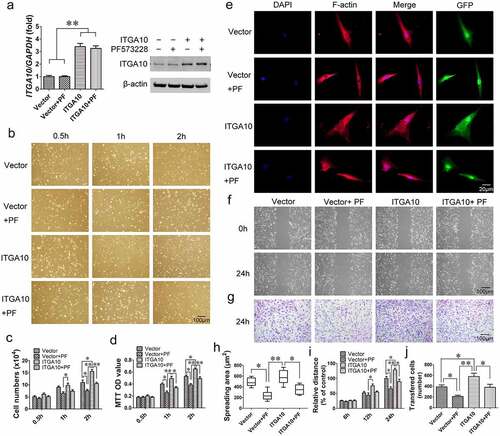
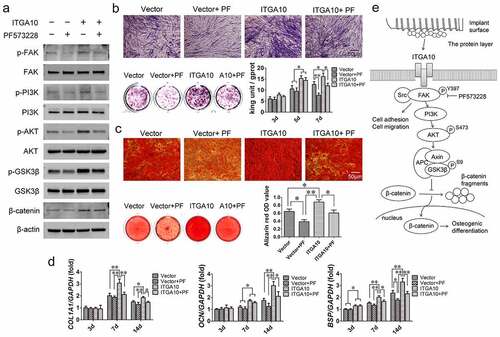
Figure 6. ITGA10 overexpression enhanced the osteogenic differentiation potential of BMSCs through the FAK/PI3K/AKT/GSK3β/β-catenin signaling pathway. (a) Western blot results showed that ITGA10 overexpression activated the FAK/PI3K/AKT/GSK3β/β-catenin signaling pathway and that PF573228 effectively inhibited this pathway. (b) ITGA10 overexpression resulted in a significant increase in ALP expression and activity in BMSCs from T2DM patients. (c) ITGA10 overexpression also significantly increased the mineralization ability of BMSCs from T2DM patients. (d) The mRNA expression levels of COL1A1, OCN, and BSP were significantly increased after ITGA10 overexpression. PF573228 significantly inhibited the enhancement effect of ITGA10 overexpression on osteogenic differentiation of BMSCs from T2DM patients. (e) ITGA10 regulated the osteogenic differentiation potential of BMSCs via the FAK/PI3K/AKT/GSK3β/β-catenin signaling pathway. The results are expressed as the mean ± standard deviation. PF represents PF573228. *P < 0.05; **P < 0.01.
Supplemental Material
Download Zip (57.3 MB)Data Availability Statement
The whole-cell proteomics datasets for BMSCs from the DM-F, DM-S, and Nor groups are available via ProteomeXchange repository with the identifier PXD016489 (https://www.ebi.ac.uk/pride/archive/projects/PXD016489).