Figures & data
Table 1. Correlations between ISLR expression and clinicopathological characteristics of gastric cancer
Figure 1. ISLR was up-regulated expression in gastric cancer. (a) The TCGA-STAD datasets indicated ISLR expression in GC tumor tissues was higher compared with that in normal tissues. (b) The ISLR expression in normal tissues and stage 1/2/3/4 of STAD. (c) As Kaplan–Meier survival plots shown, the higher ISLR abundance had relation to a poorer overall survival. (d) The mRNA expression of ISLR in tumor tissues and adjacent normal tissues of 27 patients with gastric cancer was detected using qRT-PCR. (e) Western blotting was used to detect the protein expression of ISLR in tumor tissues and adjacent normal tissues from 5 patients with gastric cancer. **P < 0.01, compared with normal tissues. T, gastric cancer tissue; N, adjacent normal tissues.
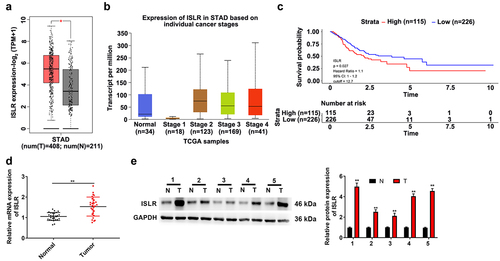
Figure 2. ISLR silencing suppressed gastric cancer cell proliferation. (a) The mRNA expression of ISLR in human gastric cancer cell lines (HGC-27, MKN-45, MGC-803, and AGS) and normal human gastric mucosa epithelial cells (GES-1) was tested using qRT-PCR. (b) HGC-27 cells were transfected with ShISLR-1, ShISLR-2, or ShRNA-NC and AGS cells were transfected with ISLR plasmids or vector, then the mRNA expression of ISLR was examined in HGC-27 and AGS cells using qRT-PCR. (c) Cell viability of HGC-27 and AGS cells was evaluated using CKK8 assay. (d) Cell proliferation of HGC-27 and AGS cells was evaluated using colony formation assay. **P < 0.01, compared with GES-1, shRNA-NC, or Vector group.
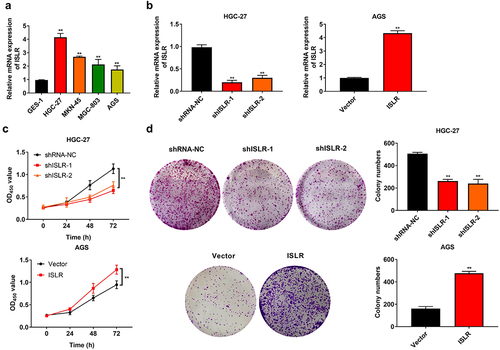
Figure 3. ISLR silencing suppressed migration and invasion in gastric cancer cells. (a) Wound healing was used to detect cell migration in HGC-27 and AGS cells. (b) Transwell assay was used to detect cell migration in HGC-27 and AGS cells. (c) Transwell assay was performed to detect cell invasion in HGC-27 and AGS cells. **P < 0.01, compared with shRNA-NC or Vector group.
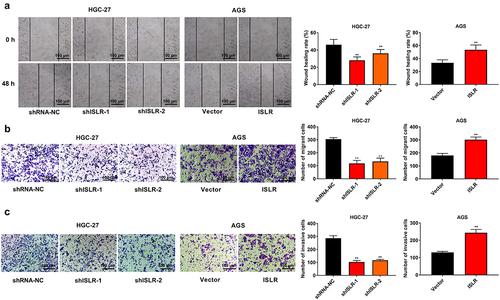
Figure 4. ISLR promotes EMT activation. (a) GESA analysis showed that ISLR regulated HALLMARK_EPITHELIAL_MESENCHYMAL_TRANSITION signaling pathway. (b) EMT downstream enrichment genes. (c-g) According to TCGA database, the expression correlation between ISLR gene and EMT markers [Snail, Twist, Vimentin, N-cadherin (also known as CDH2), and E-cadherin (also known as CDH1)] was analyzed.
![Figure 4. ISLR promotes EMT activation. (a) GESA analysis showed that ISLR regulated HALLMARK_EPITHELIAL_MESENCHYMAL_TRANSITION signaling pathway. (b) EMT downstream enrichment genes. (c-g) According to TCGA database, the expression correlation between ISLR gene and EMT markers [Snail, Twist, Vimentin, N-cadherin (also known as CDH2), and E-cadherin (also known as CDH1)] was analyzed.](/cms/asset/77f2654a-364e-4bc2-a2ab-1407907050d1/kbie_a_2079303_f0004_oc.jpg)
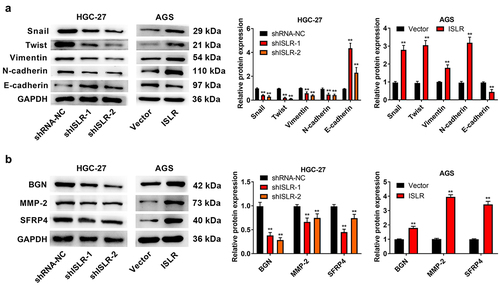
Figure 5. ISLR silencing suppressed EMT signaling pathway. (a) Western blot assay was applied to detect the expression of EMT-related proteins (Snail, Twist, Vimentin, N-cadherin, and E-cadherin) in HGC-27 and AGS cells. (b) Western blot assay was used to detect the protein expression of EMT pathway downstream enrichment genes (BGN, MMP-2, and SFRP4) in HGC-27 cells and AGS cells. **P < 0.01, compared with shRNA-NC or Vector group.