
Figures & data
Figure 1. Direct binding site exists between lncRNA XIST and miR-30c-5p Interactions between miR-30c-5p and lncRNA XIST were revealed using bioinformatic tools (Starbase). (B) Dual-luciferase reporter gene assay was performed to confirm the binding sites between lncRNA XIST and miR-30c-5p. **p<0.01 vs. mimic control.
Figure 2. Expression of lncRNA XIST and miR-30c-5p in ovarian cell linesqRT-PCR was performed to investigate the expression patterns of lncRNA XIST (a) and miR-30c-5p (b) in normal ovarian surface epithelial (IOSE80) cells and human ovarian granulosa cell-like (KGN) cells. **p < 0.01 vs. IOSE80.
Figure 3. lncRNA XIST negatively regulated miR-30c-5p expression in KGN cells We transfected KGN cells with a control or an XIST plasmid, a mimic control or an miR-30c-5p mimic, an XIST-plasmid+mimic control or an XIST-plasmid+miR-30c-5p mimic for 48 h. Then, the levels of lncRNA XIST (A) and miR-30c-5p (B, C) in the KGN cells were determined using RT-qPCR. **p<0.01 vs. control-plasmid; ##p<0.01 vs. mimic control; &&p<0.01 vs. XIST-plasmid+mimic control.
Figure 4. lncRNA XIST affects KGN cell proliferation and apoptosis via miR-30c-5pKGN cells were transfected with either control plasmid, XIST-plasmid, XIST-plasmid+mimic control, or XIST-plasmid+miR-30c-5p mimic for 48 h. The MTT assay was used to determine cell proliferation (a), cell apoptosis was measured using flow cytometry (FCM) (b), and the resulting apoptosis rates were presented statistically (c). The protein levels of Bax and Bcl-2 were detected with western blotting (d), and the mRNA levels of Bax (e) and Bcl-2 (f) were detected using RT-qPCR. **p < 0.01 vs. control-plasmid; ##p < 0.01 vs. XIST-plasmid+mimic control.
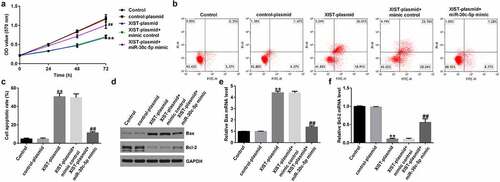
Figure 5. miR-30c-5p negatively regulated BCL2L11 expression in KGN cells(a and b) The mRNA and protein expression of BCL2L11 in normal ovarian surface epithelium (IOSE80) and human ovarian granulosa cell-like (KGN) cells were determined using qRT-PCR and a western blot assay. (c) The level of miR-30c-5p in KGN cells transfected with the mimic control or miR-30c-5p mimic was detected using RT-qPCR. (d and e) The mRNA and protein expression of BCL2L11 in KGN cells transfected with the mimic control or miR-30c-5p mimic were determined using qRT-PCR and a western blot assay. (f) The level of miR-30c-5p in KGN cells transfected with inhibitor control or miR-30c-5p inhibitor was detected using RT-qPCR. (g and h) The mRNA and protein expression of BCL2L11 in KGN cells transfected with inhibitor control or miR-30c-5p inhibitor were determined using qRT-PCR and a western blot assay. **p < 0.01 vs. IOSE80; ##p < 0.01 vs. mimic control; &&p < 0.01 vs. inhibitor control.
Figure 6. BCL2L11-siRNA reversed miR-30c-5p inhibitor induced up-regulation of BCL2L11 in KGN cell (A and B) The mRNA and protein expression of BCL2L11 in KGN cells transfected with control-siRNA or BCL2L11-siRNA were determined using qRT-PCR and a western blot assay. (C and D) The mRNA and protein expression of BCL2L11 in KGN cells transfected with the inhibitor control, miR-30c-5p inhibitor, miR-30c-5p inhibitor+control-siRNA, or miR-30c-5p inhibitor+BCL2L11-siRNA were determined using qRT-PCR and western blot assay. **p<0.01 vs. control-siRNA; ##p<0.01 vs. inhibitor control; &&p<0.01 vs. miR-30c-5p inhibitor+control-siRNA.
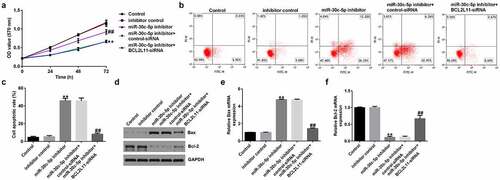
Figure 7. miR-30c-5p inhibitor affects KGN cell proliferation and apoptosis via BCL2L11KGN cells were transfected with the inhibitor control, miR-30c-5p inhibitor, miR-30c-5p inhibitor+control-siRNA, or miR-30c-5p inhibitor+BCL2L11-siRNA for 48 h. The MTT assay was used to determine cell proliferation (a), cell apoptosis was measured using FCM (b), and the resulting apoptosis rates are presented statistically (c). The protein levels of Bax and Bcl-2 were detected using a western blot assay (d), and the mRNA levels of Bax (e) and Bcl-2 (f) were detected using RT-qPCR. **p < 0.01 vs. inhibitor control; ##p < 0.01 vs. miR-30c-5p inhibitor+control-siRNA.
Supplemental Material
Download Zip (18.3 MB)Data Availability Statement
The datasets used and/or analyzed during the present study are available from the corresponding author on reasonable request.