Figures & data
Table 1. Primers sequences used for qRT-PCR.
Table 2. Relationship between circ_0092012 expression and clinicopathologic features of NSCLC patients.
Figure 1. Circ_0092012 is highly expressed in NSCLC tissues and cells. (a, b) The expression of circ_0092012 in 27 pairs of NSCLC and adjacent normal tissues, as well as in NSCLC cells and HBE cells was detected using qRT-PCR. (c, d) qRT-PCR analysis of circ_0092012 expression in H1299 and A549 cells treated with RNase R or Mock. (e, f) qRT-PCR analysis of circ_0092012 in reverse transcription using Random and Oligo(dT)18 primers in H1299 and A549 cells. (g, h) qRT-PCR analysis of FLNA and circ_0092012 expression in H1299 and A549 cells after Actinomycin D treatment. (i) The linear GAPDH and circ_0092012 in cDNA and gDNA were amplified in H1299 and A549 cells by using convergent and divergent primers, respectively. (j, k) Nuclear-cytoplasmic fractionation assay was used to investigate the subcellular localization of circ_0092012 in H1299 and A549 cells. *P < 0.05.
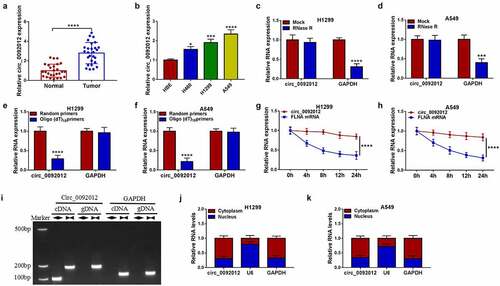
Figure 2. Circ_0092012 silencing suppresses NSCLC cell malignant biological behaviors in vitro. (a) The knockdown efficiency of si-circ_0092012 and si-NC in H1299 and A549 cells was validated using qRT-PCR. The proliferation (b, c), apoptosis (d), invasion (e) and migration (f) of H1299 and A549 cells transfected with si-circ_0092012 and si-NC were determined. (g, h) Western blotting for caspase-3, cleaved-caspase-3 and MMP2 protein levels. *P < 0.05.
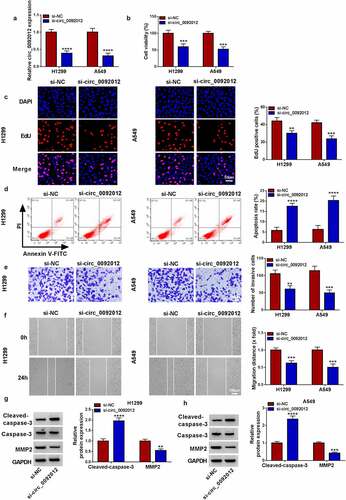
Figure 3. Circ_0092012 knockdown inhibits immune escape in NSCLC cells. (a) The apoptosis of CD8 + T cells was examined by flow cytometry. (b, c) Levels of IFN-γ and TNF-α were examined using ELISA. *P < 0.05.
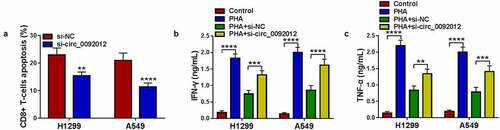
Figure 4. Circ_0092012 functions as a sponge for miR-635. (a) The predicted binding sequence of circ_0092012 and miR-635. (b) qRT-PCR for the analysis of the transfection efficiency of miR-635 or miR-NC. (c-h) The binding between circ_0092012 and miR-635 was validated using the dual-luciferase reporter assay and RIP assay. (i) Levels of miR-635 in 27 pairs of NSCLC patients was detected using qRT-PCR. (j) Negative correlation between circ_0092012 and miR-635 expression. (k) MiR-635 expression detection in NSCLC cells and HBE cells by qRT-PCR. *P < 0.05.
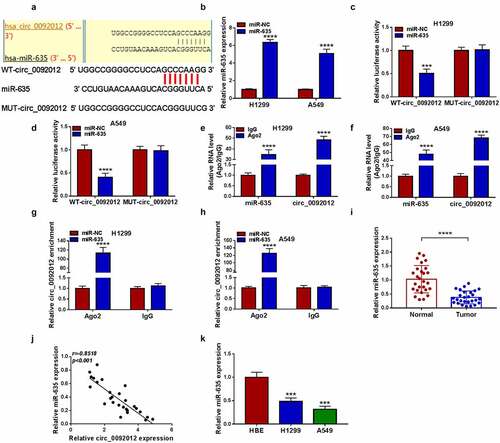
Figure 5. Circ_0092012 silencing suppresses NSCLC cell oncogenic phenotypes and immune escape by targeting miR-635. (a-k) H1299 and A549 cells were co-transfected with circ_0092012 siRNA and/or miR-635 inhibitor. (a) qRT-PCR analysis of miR-635 expression in H1299 and A549 cells. The proliferation (b, c), apoptosis (d), invasion (e) and migration (f) of H1299 and A549 cells were determined. (g, h) Western blotting for the caspase-3, MMP2 and cleaved-caspase-3 protein levels in cells. (i) The apoptosis of CD8 + T cells was examined by flow cytometry. (j, k) ELISA for the levels of IFN-γ and TNF-α. *P < 0.05.
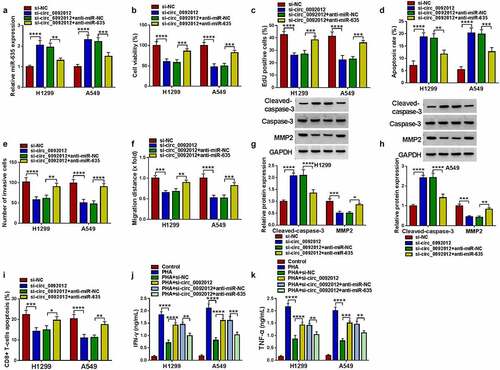
Figure 6. PDL1 is targeted by miR-635. (a) The complementary binding sequence of PDL1 and miR-635. (b-g) The binding between PDL1 and miR-635 was validated by the dual-luciferase reporter and RIP assays. (h) The expression of PDL1 mRNA in 27 pairs of NSCLC samples was tested using qRT-PCR. (i) Negative correlation between PDL1 and miR-635 expression. (j, k) Western blotting of PDL1 protein level in 27 pairs of NSCLC samples as well as in NSCLC cells and HBE cells. *P < 0.05.
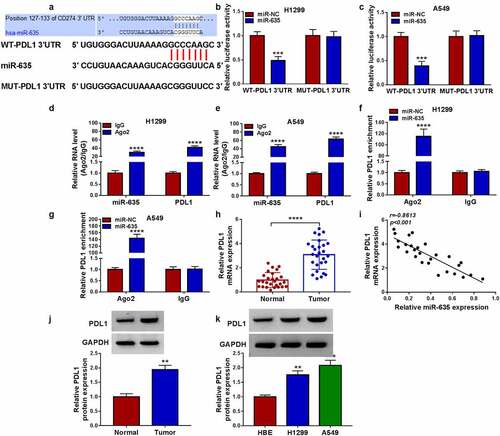
Figure 7. MiR-635 suppresses NSCLC cell malignant biological behaviors and immune escape by targeting PDL1. (a-k) H1299 and A549 cells were co-transfected with miR-635 mimic and/or PDL1 vector. (a) Western blotting of PDL1 expression in H1299 and A549 cells. The proliferation (b, c), apoptosis (d), invasion (e) and migration (f) of H1299 and A549 cells were determined. (g, h) Detection of the caspase-3, MMP2 and cleaved-caspase-3 protein levels in cells via Western blotting. (i) Flow cytometry for the apoptosis of CD8 + T cells. (j, k) Levels of IFN-γ and TNF-α were assayed using ELISA. (l) The level of PDL1 was detected in H1299 and A549 cells co-transfected with circ_0092012 siRNA and/or miR-635 inhibitor using western blotting. *P < 0.05.
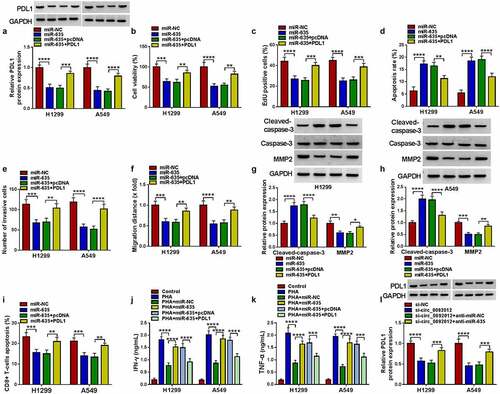
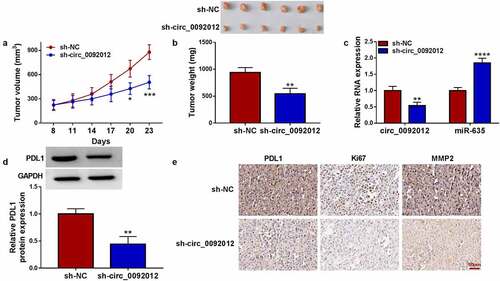
Figure 8. Circ_0092012 knockdown impedes NSCLC tumor growth in vivo. (a, b) The in vivo growth curve, representative images (upper panel), and tumor weight of xenografts. (c, d) Levels of circ_0092012, miR-635 and PDL1 in xenografts. (e) IHC staining for the protein of PDL1, Ki67 and MMP2 in the subcutaneous xenografts. *P < 0.05.