
Figures & data
Figure 1. OVA-induction increased miR-205-5P level, sneezing and nose scratching. (a) The expression of miR-205-5P level. (b) The levels of sneezing and nose scratching. **P < 0.01, ***P < 0.001 versus control group.
Figure 2. MiR-205-5P inhibitor improved allergic rhinitis. (a) The expression of miR-205-5P in nasal mucosa. (b) The levels of sneezing and nose scratching. (c) The thickness of nasal mucosa. (d) Histological analyses for AR nasals mucosa tissue. (e) Number of mast cell infiltration. (f) HE staining for analysis of mast cell infiltration. ***P < 0.001 versus control group, ###P < 0.001 versus AR + inhibitor NC.
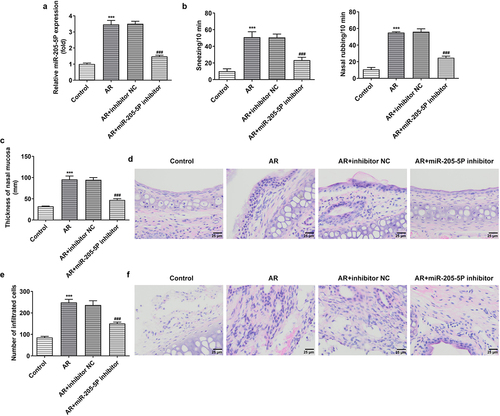
Figure 3. MiR-205-5P inhibitor modulated the levels of Th1/Th2 cytokines and decreased lgE and histamine levels in OVA-induced AR mice. (a) The levels of IL-2, IFN-γ, IL-4 and IL-13. (b) IgE level. (c) Histamine level. ***P < 0.001 versus control group, ##P < 0.01, ###P < 0.001 versus AR + inhibitor NC.
Figure 4. miR-205-5P inhibitor increased decreased PEBP1 expression and the expressions of HMGB1/TLR4. ***P < 0.001 versus control group, ##P < 0.01, ###P < 0.001 versus AR + inhibitor NC.
Figure 5. DNP IgE/HAS treatment induced the expression of miR-205-5P/PEBP1/HMGB1 in BL-2H3 cells. (a) The level of miR-205-5P. ***P < 0.001 versus control group. (b) The mRNA levels of PEBP1/ HMGB1/TLR4. ***P < 0.001 versus control group. (c) The protein levels of PEBP1/ HMGB1/TLR4. ***P < 0.001 versus control group. (d) The level of miR-205-5P. ***P < 0.001 versus mimic-NC. (e) The relationship of miR-205-5P and PEBP1 was detected by Luciferase report assay. ***P < 0.001 versus miR-205-5p mimic+PEBP1 + WT.
Figure 6. miR-205-5P/ PEBP1 regulated degranulation of BL-2H3 cells. (a) The mRNA level of PEBP1. (b) The protein level of PEBP1. ***P < 0.001 versus siRNA-NC. (c) The detection of β-hexosaminidase activity. (d) Histamine release level. (e) The expressions of TLR4 and HMGB1. ***P < 0.001 versus control group. ###P < 0.001 versus anti-DNP IgE + inhibitor NC. ΔΔP<0.01, ΔΔΔP<0.001.
Data availability statement
The datasets used and/or analyzed during the current study are available from the corresponding author on reasonable request.