
Figures & data
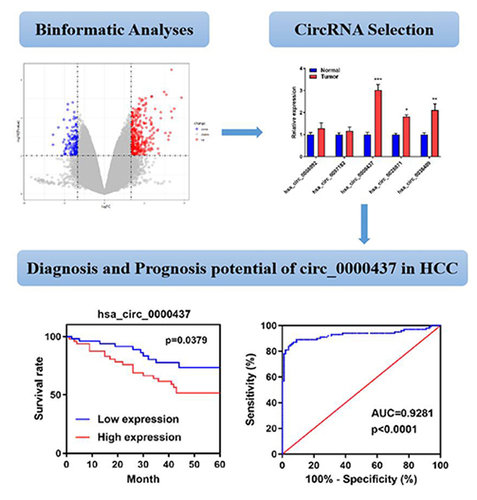
Table 1. Correlation between hsa_circ_0000437 expression and clinical parameters in HCC.
Figure 1. Aberrantly expressed circRNAs identified in GSE166678 associated with HCC. A. Heat map of abnormally expressed circRNAs. B. Volcano map of abnormally expressed circRNAs. C. RT-qPCR analyses of circ_0008092, circ_0097182, circ_0000437, circ_0028071, and circ_0036409 expression in HCC tissues and healthy controls. *P< 0.05, **P< 0.01, ***P< 0.001.
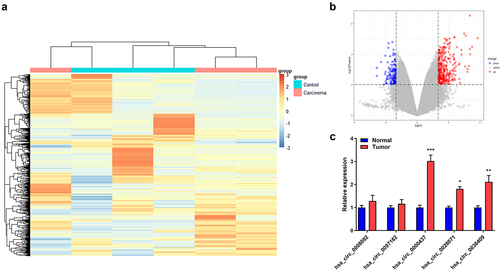
Figure 2. Expression of circ_0000437 in the tissues and serum of the normal control and tumor groups. ***P< 0.001.
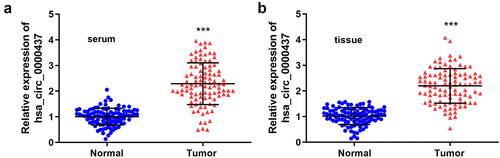
Table 2. Relationship between the expression of hsa_circ_0000437 in serum and clinical characteristics of enrolled HCC patients.
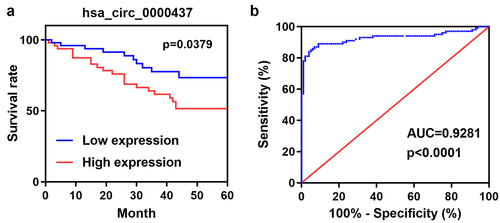
Figure 3. OS and ROC curves of circ_0000437 in HCC.
Data availability statement
The datasets used and analyzed during the current study are available from the corresponding author on reasonable request.