
Figures & data
Table 1. The clinicopathological features of glioma patient in this study.
Figure 1. High expression levels of SOCS5 were observed in glioblastoma (GBM) tissues and cell lines a) qRT-PCR analysis of SOCS5 in tissue samples from different clinical stages. SOCS5 is overexpressed in GBM tissues; n = 10 patients at each clinical stage. b) The expression levels of SOCS5 were analyzed by qRT-PCR in GBM cell lines U87, U251, and LN229, and compared with those in normal human astrocytes (NHAs). All experiments were repeated three times, and results shown are representative of three repetitions. Statistic tests were performed using a one-way ANOVA. *P < 0.05; **P < 0.01, ***P < 0.001.
Figure 2. SOCS5 expression is correlated with recurrence and TMZ-chemoresistance in GBM. a, b) IHC and WB quantitative analyses of SOCS5 in primary and recurrent GBM, compared with adjacent tissue. We found that SOCS5 is upregulated in recurrent patients and is predominantly diffuse throughout the cell cytoplasm. Scale bar, 100 μm. c) Increased TMZ dosage significantly elevated SOCS5 expression level. d) Establishment of TMZ-resistant U87/TMZ and U251/TMZ cells using a cell-line-based model. e) WB quantitative analyses of SOCS5 in U87/TMZ and U251/TMZ cells, compared with parental cell lines (U87 or U251). All experiments were repeated three times, and results shown are representative of three repetitions. Statistic tests were performed using t-test (a, b, e) or one-way ANOVA followed by Tukey’s test (c). *P < 0.05; **P < 0.01, ***P < 0.001.
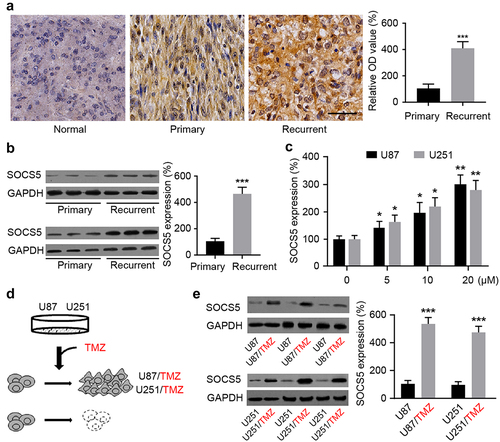
Figure 3. SOCS5 is involved in TMZ-chemoresistance in glioblastoma (GBM) cells. a, b) qRT-PCR and WB analyses of SOCS5 upon LV-mediated shRNA silencing of SOCS5 expression in U87/TMZ and U251/TMZ cells. c) MTT assay was performed to evaluate the effect of SOCS5 silencing on cell viability. *P < 0.05. d) Cell apoptosis was analyzed using flow cytometric assay. SOCS5 knockdown facilitates sensitivity to TMZ treatment. e) Apoptosis was analyzed using a TUNEL kit. f) The protein levels of cleaved caspase 3 and cleaved caspase 9 were detected by western blotting. Treatment with Con-shRNA was used as the negative control. All experiments were repeated three times, and results shown are representative of three repetitions. Statistic tests were performed using t-test (a, b, d) or two-way ANOVA followed by Tukey’s test (c). ***P < 0.001.
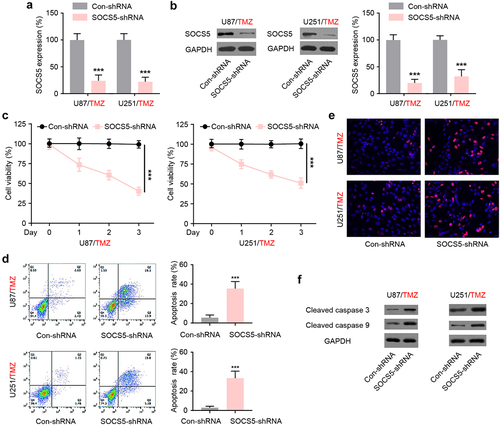
Figure 4. SOCS5 and autophagy are enhanced in glioblastoma (GBM) cells upon TMZ treatment. a) Immunofluorescence analysis of SOCS5 in U87/TMZ cells after TMZ treatment. Scale bar, 20 μm. b) Western blot and quantitative analysis results of SOCS5 in U87/TMZ cells after TMZ treatment. c) Immunofluorescence analysis of GFP-LC3 puncta formation in U87/TMZ cells after TMZ treatment. Scale bar, 5 μm. d) WB analysis of different autophagy-related marker protein levels in U87/TMZ cells after TMZ treatment. All experiments were repeated three times, and results shown are representative of three repetitions. Statistic tests were performed using a one-way ANOVA followed by Tukey’s test. *P < 0.05, **P < 0.01, ***P < 0.001.
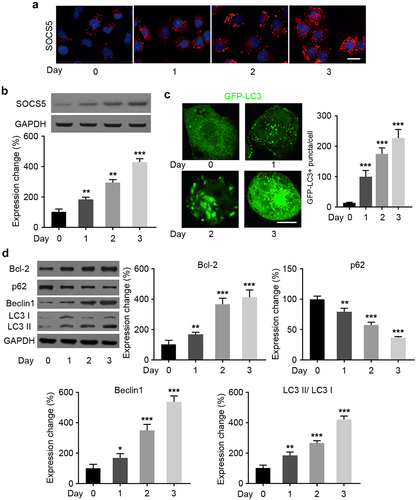
Figure 5. SOCS5 induces Bcl2 upregulation in glioblastoma (GBM) cells resistant to TMZ. a) Luciferase reporter assays were conducted to demonstrate the interaction between SOCS5 and Bcl-2 in U87/TMZ and U251/TMZ cells. b, c) The expression level of Bcl-2 was assessed in response to the upregulation/knockdown of SOCS5 in both U87/TMZ and U251/TMZ cells. All experiments were repeated three times, and results shown are representative of three repetitions. Statistic tests were performed using t-test (b, c) or two-way ANOVA followed by Tukey’s test (a). **P < 0.01, ***P < 0.001.
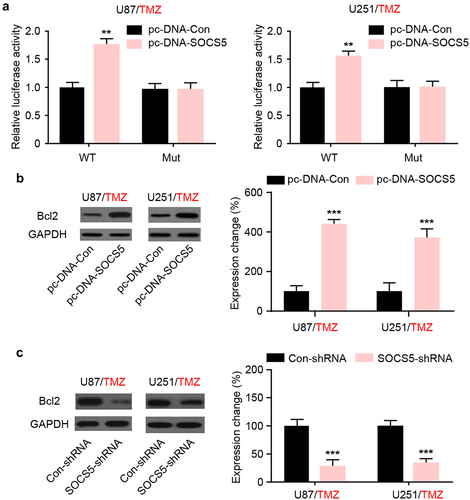
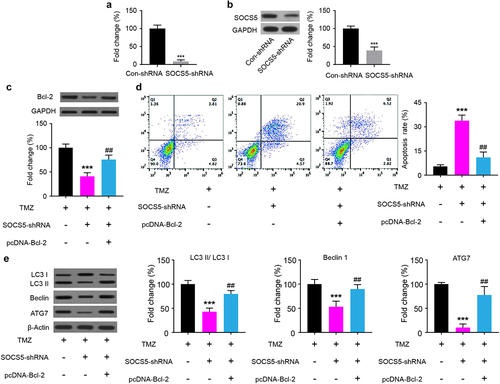
Figure 6. SOCS5 knockdown partly reverses Bcl-2 levels in glioblastoma (GBM) cells resistant to TMZ in U87/TMZ cells. a, b) Knockdown of SOCS5 effectively decreased the mRNA and protein expression levels of SOCS5. c) WB analysis of Bcl-2 protein levels in U87/TMZ cells transfected with SOCS5-shRNA and pcDNA-Bcl-2. d) Cell apoptosis was analyzed using flow cytometry to explore the effect of Bcl-2 restoration in U87/TMZ cells. e) The effect of Bcl-2 restoration on autophagy-related protein expression in U87/TMZ cells was determined using western blotting and compared to TMZ (***P < 0.001) or to MTZ+SOCS5-shRNA (##P < 0.01). All experiments were repeated three times, and results shown are representative of three repetitions. Statistic tests were performed using t-test (a, b) or one-way ANOVA followed by Tukey’s test (c, d, e).
Supplemental Material
Download Zip (6.4 MB)Data availability statement
The datasets used or analyzed during the current study are available from the corresponding author upon reasonable request.