Figures & data
Figure 1. miR-122-3p inhibited apoptosis of IL-1β-treated MH7A cell. (a) The qRT-PCR for the expression of miR-122-3p in synovial tissues and peripheral blood samples of patients without RA or with RA. (b) CCK-8 assay for the cell viability of M7HA cells stimulated with different concentrations of IL-1β (1 ng/ml, 5 ng/ml, and 10 ng/ml). (c) QRT-PCR for the expression of miR-122-3p in MH7A cells stimulated with different concentrations of IL-1β (1 ng/ml, 5 ng/ml, and 10 ng/ml). (d) The qRT-PCR for the miR-122-3p level in M7HA cells. **P < 0.01. (e) CCK-8 assay for the cell viability of MH7A cells. (f) Flow cytometric analysis for apoptosis. (g) Western blotting for the levels of Bax, Bcl-2, and cleaved caspase-3. **P < 0.01 vs. control group, ##P < 0.01 vs. IL-1β+mimic NC group. (h) The qRT-PCR for the miR-122-3p expression in M7HA cells. **P < 0.01. (i) CCK-8 assay for the cell viability of MH7A cells. (j) Flow cytometric analysis for apoptosis of MH7A cells. (k) Western blotting for the levels of Bax, Bcl-2, and cleaved caspase-3 in MH7A cells. **P < 0.01 vs. control group, ##P < 0.01 vs. IL-1β+inhibitor NC group.
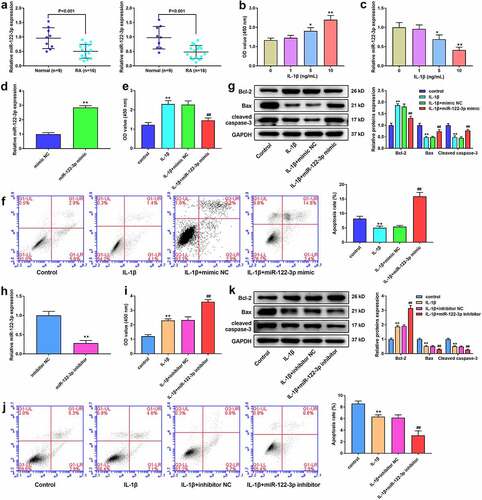
Figure 2. miR-122-3p was a target of LINC00665 in MH7A cells. (a) The Diana tools were used for the binding sites between LINC00665 and miR-122-3p. (b) Luciferase reporter activity. (B) RNA pull-down assay to confirm the target relationship between LINC00665 and miR-122-3p. (d) The qRT-PCR to detect LINC00665 level in tissues. (e) QRT-PCR to detect LINC00665 in IL-1β (10 ng/ml) treated MH7A cells. (f) QRT-PCR to detect LINC00665 level in MH7A cells. (g) QRT-PCR to detect miR-122-3p expression in MH7A cells after transfection with LINC00665 overexpressed plasmid and LINC00665 siRNAs. **P < 0.01.
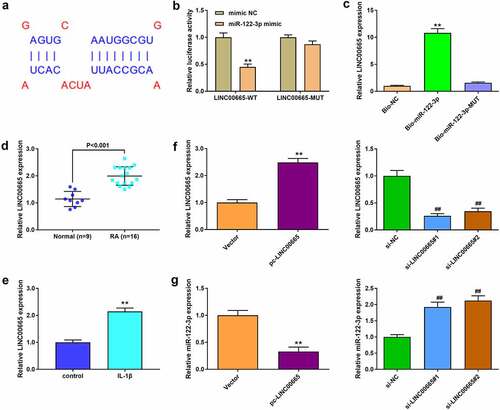
Figure 3. LINC00665 eliminates the inhibited effect of miR-122-3p on MH7A cells. (a) CCK-8 assay to detect cell viability of MH7A cells after transfection with miR-122-3p mimic and LINC00665 overexpressed plasmid. (b) Flow cytometric analysis for apoptosis of IL-1β treated MH7A cells. (c) Western blotting for Bax, Bcl-2, and cleaved caspase-3 expression in MH7A cells. **P < 0.01 vs. Vector group, ##P < 0.01 vs. mimic NC group, &&P < 0.01 vs. miR-122-3p group. (d) CCK-8 assay for cell viability of MH7A cells after co-transfection with miR-122-3p inhibitor and LINC00665 siRNA. (e) Flow cytometric analysis for apoptosis of IL-1β treated MH7A cells. (f) Western blotting for the levels of Bax, Bcl-2, and cleaved caspase-3 in IL-1β treated MH7A cells. **P < 0.01 vs. si-NC group, ##P < 0.01 vs. inhibitor NC group, &&P < 0.01 vs. miR-122-3p inhibitor group.
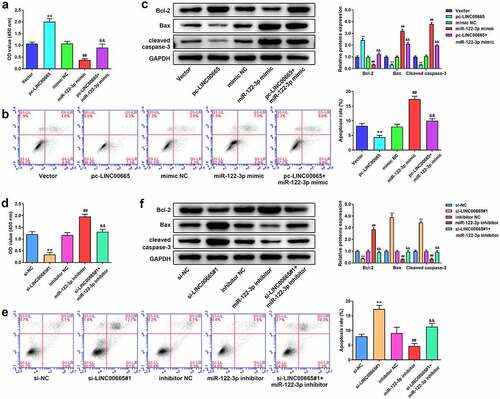
Figure 4. EIF2AK1 is a target gene of miR-122-3p. (a) TargetScan was used for miR-122-3p target gene analysis. (b) Luciferase reporter activity in MH7A cells. **P < 0.01 vs. mimic NC group. (C/D) The EIF2AK1 expression in RA tissues and cells. (E/F) The EIF2AK1 expression in MH7A cells. **P < 0.01.
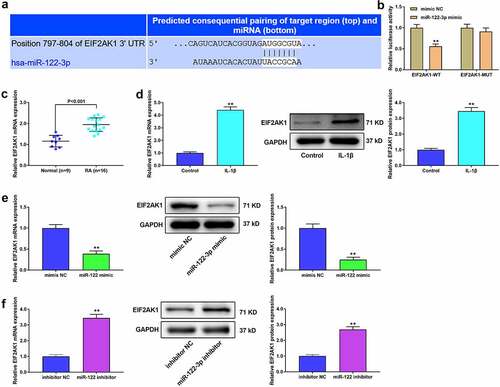
Figure 5. LINC00665 regulates EIF2AK1 expression by targeting miR-122-3p. (a) The correlationship between LINC00665 and miR-122-3p. (b) The correlationship between LINC00665 and EIF2AK1. (c) The correlationship between miR-122-3p and EIF2AK1. (D/E) The EIF2AK1 expression in MH7A cells. **P < 0.01 vs. Vector group, ##P < 0.01 vs. pc-LINC00665+ mimic NC group.
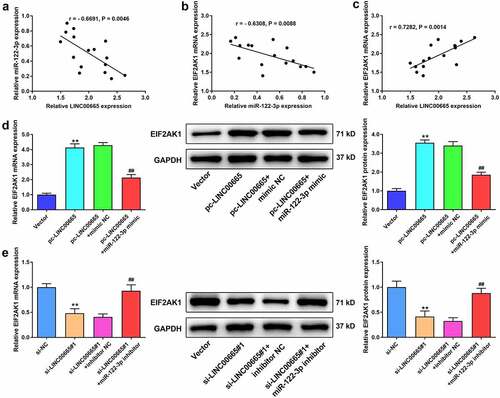
Figure 6. LINC00665 silence eliminates the promoted effect of EIF2AK1 overexpression on MH7A cells. (a) QRT-PCR and western blotting were used to measure EIF2AK1 expression in MH7A cells after transfection with EIF2AK1 overexpressed plasmid. (b) CCK-8 assay to detect cell viability of MH7A cells after transfection with EIF2AK1 overexpressed plasmid and LINC00665 siRNA. (c) Flow cytometric analysis for apoptosis of IL-1β treated MH7A cells. (d) Western blotting for Bax, Bcl-2, and cleaved caspase-3 expression in MH7A cells. **P < 0.01 vs. Vector group, ##P < 0.01 vs. pc-EIF2AK1+ si-NC group. (e) QRT-PCR and western blotting were used to measure EIF2AK1 expression in MH7A cells after transfection with EIF2AK1 siRNAs (f) CCK-8 assay for cell viability of MH7A cells after co-transfection with EIF2AK1 siRNA and LINC00665 overexpressed plasmid. (g) Flow cytometric analysis for apoptosis of IL-1β treated MH7A cells. (h) Western blotting for the levels of Bax, Bcl-2, and cleaved caspase-3 in IL-1β treated MH7A cells. **P < 0.01 vs. si-NC group, ##P < 0.01 vs. si-EIF2AK1#1+ Vector group.
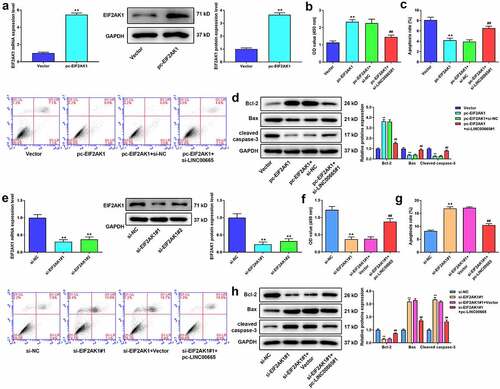
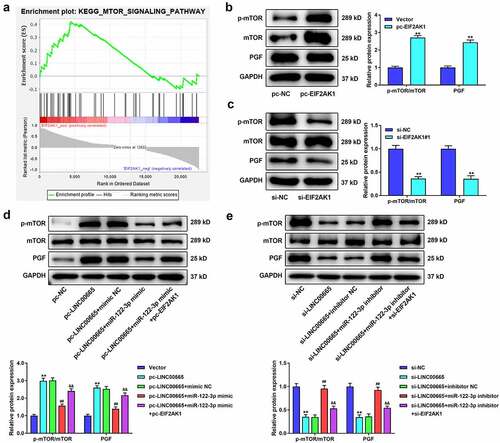
Figure 7. LINC00665 activates the mTOR pathway by regulating EIF2AK1 in MH7A cells. (a) The analysis of Gene set enrichment analysis (GSEA) showed that EIF2AK1 activated mTOR signaling pathway. (b) Western blotting for the levels of p-mTOR/mTOR and PGF in MH7A cells after transfection with EIF2AK1 overexpressed plasmid. **P < 0.01 vs. Vector group. (c) Western blotting for the levels of p-mTOR/mTOR and PGF in MH7A cells after transfection with EIF2AK1 siRNA. **P < 0.01 vs. si-NC group. (d) Western blotting for the levels of p-mTOR/mTOR and PGF in MH7A cells after co-transfection with LINC00665 overexpressed plasmid, miR-122-3p mimic, and EIF2AK1 overexpressed plasmid. **P < 0.01 vs. Vector group, ##P < 0.01 vs. pc-LINC00665+ mimic NC group, &&P < 0.01 vs. pc-LINC00665+ miR-122-3p mimic group. (e) Western blotting for the levels of p-mTOR/mTOR and PGF in MH7A cells after transfection with LINC00665 siRNA, miR-122-3p inhibitor, and EIF2AK1 siRNA. **P < 0.01 vs. si-NC group, ##P < 0.01 vs. si-LINC00665+ inhibitor NC group, &&P < 0.01 vs. si-LINC00665+ miR-122-3p inhibitor group.