Figures & data
Table 1. Real-time qPCR primers for genes.
Figure 1. SalB protected against MN in rats and exacerbated by miR-145-5p antagomir. (a) The condensed structural formulas of SalB. (b) Relative miR-145-5p levels in the kidneys from different groups of rats. (c) 24 h urine protein levels for 1 to 6 weeks in different groups of rats. (d-e) SCr and BUN concentration in different groups of rats. (f) Quantitative representation of the total number of IgG-positive nuclei per HPF. (g) Representative micrographs showing the morphology by PAS staining (40×) from different groups of rats. (h) Representative sections of the kidneys stained for IgG (40×) from different groups of rats. *P < 0.05, **P < 0.01, ***P < 0.001 versus the MN group; ###P < 0.001 versus the Control group.
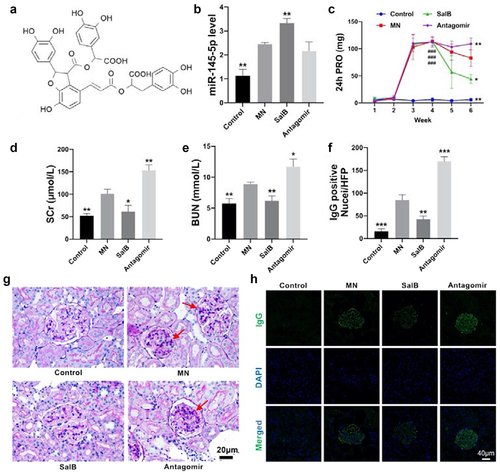
Figure 2. SalB reduced renal inflammatory responses in MN rats and elevated by miR-145-5p antagomir. (a-d) The mRNA levels of proinflammatory mediators including IL-1β, IL-2, IL-6 and TNF-α in the kidneys from different groups of rats. (e) Representative sections of the kidneys were stained for macrophages (40×) from different groups of rats. (f) Data analysis of macrophage infiltrates in the kidneys (numbers per high-power field [HPF]) from different groups of rats. *P < 0.05, **P < 0.01, ***P < 0.001 versus the MN group.
![Figure 2. SalB reduced renal inflammatory responses in MN rats and elevated by miR-145-5p antagomir. (a-d) The mRNA levels of proinflammatory mediators including IL-1β, IL-2, IL-6 and TNF-α in the kidneys from different groups of rats. (e) Representative sections of the kidneys were stained for macrophages (40×) from different groups of rats. (f) Data analysis of macrophage infiltrates in the kidneys (numbers per high-power field [HPF]) from different groups of rats. *P < 0.05, **P < 0.01, ***P < 0.001 versus the MN group.](/cms/asset/4496adbf-6865-4b4b-aaad-bfc6a3ead0c8/kbie_a_2083822_f0002_oc.jpg)
Figure 3. SalB contributed to LPS-induced cell proliferation and production of proinflammatory mediators via miR-145-5p in HMCs. (a and b) Summarized data showing the overall percentage of cell cycle, including the number of cells in S-phase determined by flow cytometric analysis in HMCs with different treatments. (c) Proliferation rate of HMCs with different treatments were detected by Cell Counting Kit-8 (CCK8). (d-g) The mRNA levels of proinflammatory mediators including IL-1β, IL-2, IL-6 and TNF-α in HMCs with different treatments. Ctr, control; L, LPS; S, SalB; I, miR-145-5p inhibitor; NC, miR-145-5p negative control. *P < 0.05, **P < 0.01, ***P < 0.001 versus the L+ NC group; #P < 0.05, ##P < 0.01, ###P < 0.001 versus the L + S+ NC group (n = 6).
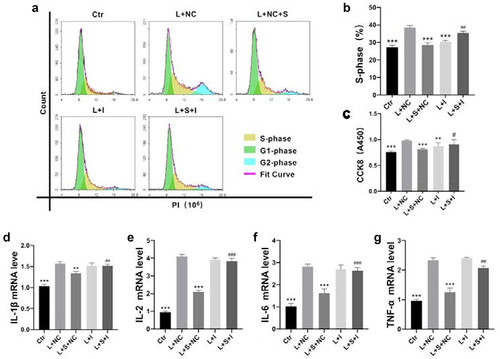
Figure 4. SalB activated glomerular mesangium autophagy via miR-145-5p. (a) Representative sections of glomerular mesangium for autophagosomes (15000×) by TEM from different groups of rats. The red arrows indicated autophagosomes and autolysosomes. (b) Schematic diagram of mRFP-GFP-LC3 adenoviral vectors detecting autophagic flux. (c) Quantitative representation of the total number of autolysosomes (red puncta) and autophagosomes (yellow puncta) per HMC (n = 6). (D, G and H) Summarized data showing the expression levels of beclin1 and LC3B in the kidneys from different groups of rats (n = 6). (f) Representative sections of HMCs for autophagic flux (400×) with different treatments (n = 6). (e, i, and j) Summarized data showing the expression levels of beclin1 and LC3B in HMCs with different treatments (n = 6). Ctr, control; L, LPS; S, SalB; I, miR-145-5p inhibitor; NC, miR-145-5p negative control. *P < 0.05, **P < 0.01, ***P < 0.001 versus MN group in rats or L+ NC group in HMCs; ##P < 0.01 versus L + S+ NC group; aaaP < 0.001 versus autolysosomes in L+ NC group; bbbP < 0.001 versus autophagosomes in L+ NC group; cccP < 0.001 versus autolysosomes in the L + S+ NC group; dddP < 0.001 versus autophagosomes in the L + S+ NC group.
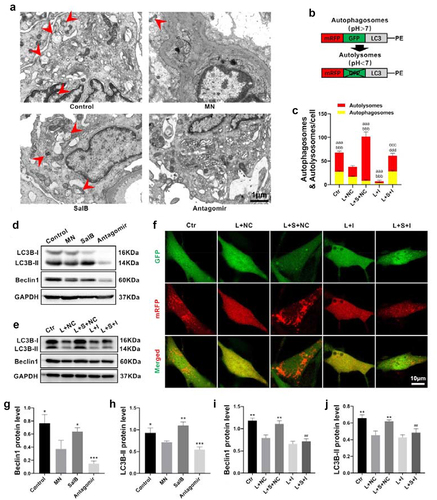
Figure 5. SalB activated autophagy by inhibiting PI3K/AKT pathway via miR-145-5p. (a-c) Summarized data showing the expression levels of PI3K and P-AKT (Ser473) in the kidneys from different groups of rats. (d-i) Summarized data showing the expression levels of PI3K and P-AKT (Ser473) in HMCs with different treatments (n = 6). (j-k) Relative miR-145-5p levels in HMCs with different treatments (n = 6). Ctr, control; L, LPS; S, SalB; I, miR-145-5p inhibitor; M, miR-145-5p mimic; LY, LY294002; NC, miR-145-5p negative control. *P < 0.05, **P < 0.01, ***P < 0.001 versus the MN group in rats or the L+ NC group in HMCs; ###P < 0.001 versus the L + S+ NC group or the L+ LY+NC group.
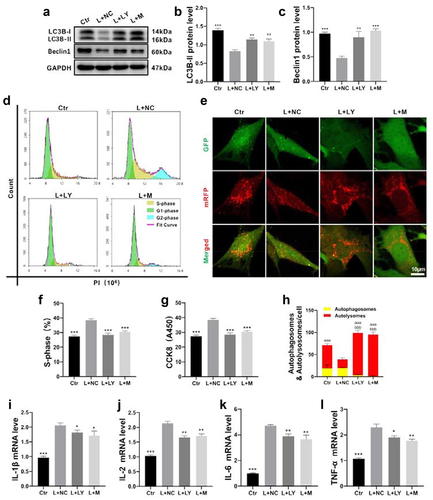
Figure 6. Promoting mesangial cells autophagy inhibited cell proliferation and inflammation. (a-c) Summarized data showing the expression levels of beclin1 and LC3B in HMCs with different treatments. (d and f) Summarized data showing the overall percentage of cell cycle, including the number of cells in S-phase determined by flow cytometric analysis in HMCs with different treatments. (g) Proliferation rate of HMCs with different treatments were detected by Cell Counting Kit-8 (CCK8). (e) Representative sections of HMCs for autophagic flux (400×) with different treatments. (h) Quantitative representation of the total number of autolysosomes (red puncta) and autophagosomes (yellow puncta) per HMC. (i-l) The mRNA levels of proinflammatory mediators including IL-1β, IL-2, IL-6 and TNF-α in HMCs with different treatments. Ctr, control; L, LPS; S, SalB; M, miR-145-5p mimic; LY, LY294002; NC, miR-145-5p negative control. *P < 0.05, **P < 0.01, ***P < 0.001 versus the L+ NC group; aaaP < 0.001 versus autolysosomes in the L+ NC group; bbbP < 0.001 versus autophagosomes in the L+ NC group (n = 6).