Figures & data
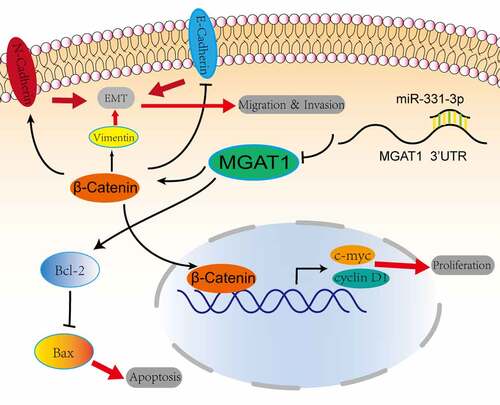
Table I. Primer sequences used for reverse transcription-quantitative PCR.
Figure 1. OS tissues and cell lines exhibited low-expressed miR-331-3p but highly expressed MGAT1. (a) Differentially expressed miRNAs between OS and normal tissues were analyzed using volcano plots. (b) Upregulated and downregulated miRNAs from the GSE65071 dataset were compared using a clustered heat map. (c) Top 25 down-regulated miRNAs. (d) Using the GSE65071 dataset, the expression levels of miR-331-3p were determined in OS tissues. (e) Utilization of RT-qPCR to quantify miR-331-3p in OS cell lines, respectively. (f) OS tissues (n = 262) and non-tumor tissues (n = 2) MGAT1 mRNA expression levels were determined using GEPIA bioinformatics analysis. (g) MGAT1 mRNA expression levels were determined in hFOB1.19, MG-63, Saos-2, and U2OS cells using RT-qPCR. (h) WB was utilized to determine MGAT1 protein expression in hFOB1.19, MG63, Saos-2 and U2OS cells. *P < 0.05, **P < 0.01 and ***P < 0.001.
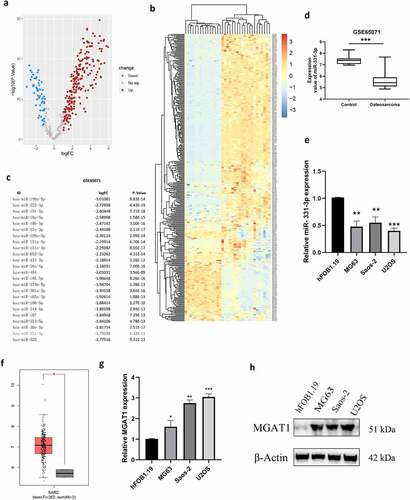
Figure 2. Malignancy of OS cells was affected by miR-331-3p. (a) RT-qPCR was utilized to quantify miR-331-3p expression in miR-331-3p mimic and miR-331-3p inhibitor group. (b) Following treatment with the miR-331-3p mimic or inhibitor, U2OS and saos-2 cells proliferation ability were assessed. (c and d) Migration and invasion abilities were quantified in U2OS and saos-2 cells transfected with the miR-331-3p mimic or miR-331-3p inhibitor, respectively. (e) Cell migration was observed at 0, 24, 48, 72 hours after scratching the cell layers. *P < 0.05, **P < 0.01 and ***P < 0.001.
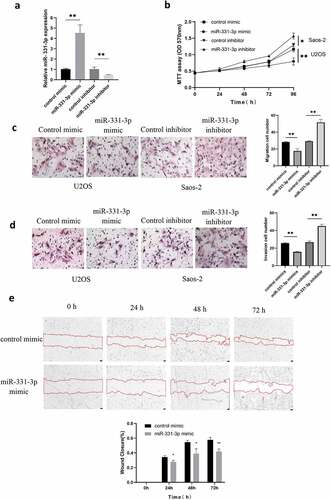
Figure 3. MiR-331-3p targeted MGAT1 (a) The binding site between miR-331-3p and the MGAT1 3’UTR was identified using Targetscan. (b) Confirmation of interaction between miR-331-3p and MGAT1 by dual-luciferase reporter assay. (c) RT-qPCR was used to quantify MGAT1 mRNA in U2OS and saos-2 cells treated with the miR-331-3p mimic or inhibitor, respectively. (d) WB showed MGAT1 expression in U2OS and saos-2 cells after transfected with the miR-331-3p mimic or inhibitor, respectively. *P < 0.05, **P < 0.01 and ***P < 0.001.
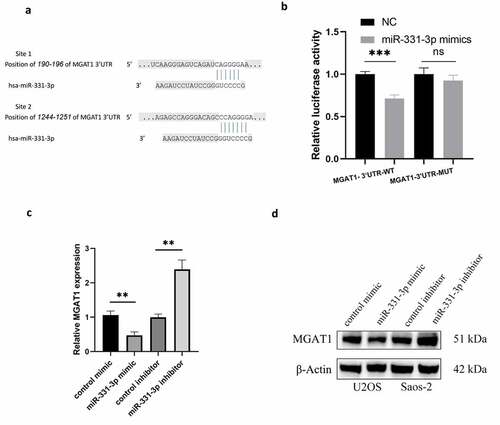
Figure 4. MiR-331-3p promoted the cell cycle transition and apoptosis of OS cells. (a) Cell cycle analysis was performed in OS cells using flow cytometry 72 h following transfection with the control inhibitor, miR-331-3p inhibitor, control mimic and miR-331-3p mimic. (b) Flow cytometry was performed to detect apoptotic cells 72 h following transfection with the control mimic and miR-331-3p mimic.*P < 0.05, **P < 0.01 and ***P < 0.001.
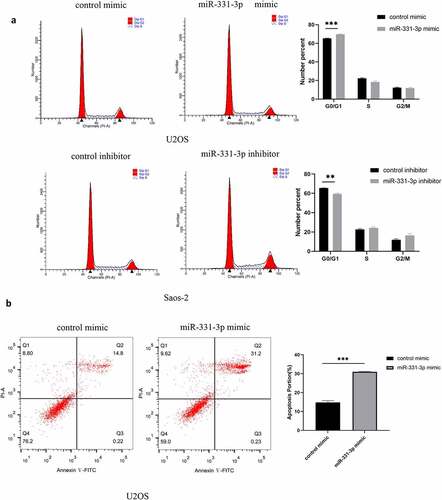
Figure 5. MGAT1 knockdown partially reduced the effect of miR-331-3p on U2OS cells. (a) Following MGAT1 siRNA transfection, RT-qPCR was utilized to quantify MGAT1 mRNA in U2OS cells. (b) U2OS cells proliferation following transfection with miR-331-3p inhibitor, MGAT1 siRNA, or miR-331-3p inhibitor and MGAT1 siRNA co-transfection, was assessed using the MTT assay. (c and d) Utilization of transwell for assessment of U2OS cells migration and invasion capacities 72 hours after treated with the miR-331-3p inhibitor, MGAT1 siRNA and miR-331-3p inhibitor, or MGAT1 siRNA and miR-331-3p inhibitor co-transfection. (e) Cell migration was observed 48 hours after scratching the cell layers. *P < 0.05, **P < 0.01 and ***P < 0.001.
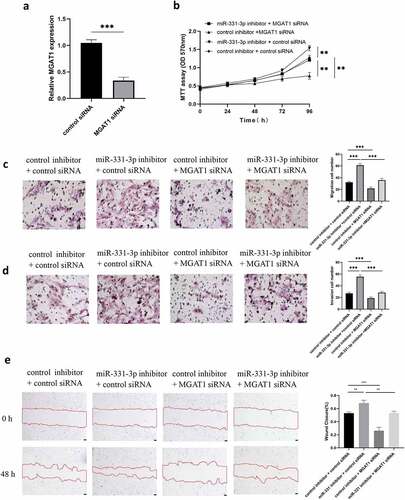
Figure 6. MiR-331-3p/MGAT1 axis regulated OS malignant behavior via the EMT and the Wnt/β-Catenin and Bcl-2/Bax signaling pathways. (a) Evaluation of Wnt/β-Catenin signaling pathway related proteins, in control/miR-331-3p mimic transfected U2OS cells and control/miR-331-3p inhibitor transfected Saos-2 cells by WB assay. (b) WB exhibited EMT-related proteins, Bcl-2 and Bax, in control/miR-331-3p mimic transfected U2OS and saos-2 cells. (c) WB exhibited Wnt/β-Catenin pathway and the EMT related proteins after treated with the MGAT1 siRNA, miR-331-3p inhibitor, and miR-331-3p inhibitor or MGAT1 siRNA co-transfection.
Figure 6. Continued.
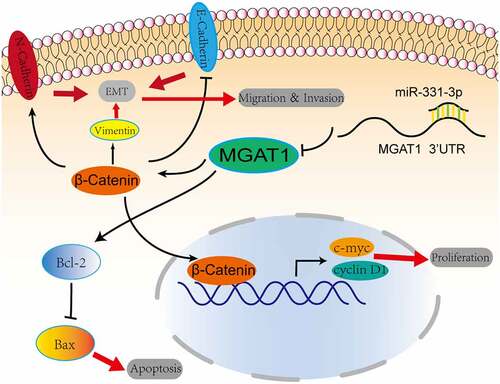
Figure 7. Graphic representation of the role of the miR-331-3p/MGAT1 axis in OS malignancy. MiR-331-3p suppressed MGAT1 expression, which resulted in decreased c-myc and Cyclin D1 proteins and decreased OS cells proliferation ability. MiR-331-3p decreased MGAT1 expression, which resulted in an increase in Bax and a decrease in Bcl-2, which was associated with an increase in OS cells apoptosis. Furthermore, miR-331-3p reduced MGAT1 expression levelby interacting with MGAT1 3’UTR, which resulted in decreased EMT, leading to a reduction in OS cells migration, invasion and metastasis capacities.