
Figures & data
Figure 1. LINC00514 was upregulated in NSCLC and associated with a poor prognosis. (a) According to the LncExpDB database, LINC00514 was highly expressed in NSCLC lines, especially lung adenocarcinoma. (b) LINC00514 was significantly higher in NSCLC tumors (n = 535) versus normal tissues (n = 59) by analyzing the TCGA database. (c) Online Kaplan-Meier analysis assessed the association between LINC00514 expression level and overall survival in NSCLC patients (log-rank p 5.6e-5; HR 1.4; 95%CI 1.19–1.65; n = 1144). (d) qRT-PCR analysis showed increased expression of LINC00514 in NSCLC tumors versus adjacent normal tissues (n = 30). (e) LINC00514 was higher expressed in NSCLC cells. Three independent experiments were performed. Data are presented as the mean ± SD. LUAD, lung adenocarcinoma; qRT-PCR, quantitative real-time polymerase chain reaction; SD, standard deviation; NC, negative control; *p < 0.05, **p < 0.01, compared with normal tissues and HBE.
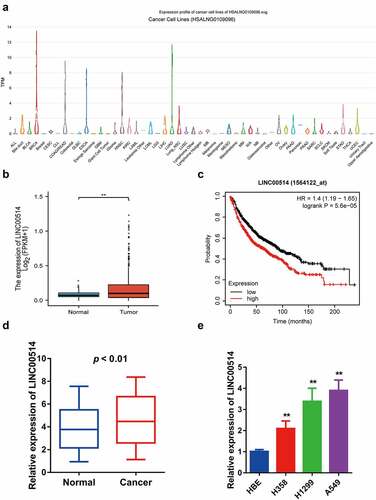
Figure 2. Silencing LINC00514 inhibited the proliferation, migration, and invasion of NSCLC cells in vitro. (a) Reduced expression of LINC00514 after transfection of H1299/A549 cells. (b) CCK-8 assay showed that suppression of LINC00514 restrained the cell proliferation of H1299/A549. (c) Colony formation assay indicated that cell proliferation capacity was reduced in LINC00514 knockdown H1299/A549 cells. (d) Transwell assay indicated that LINC00514 silencing inhibited the migration and invasion of H1299/A549 cells. Data are presented as the mean ± SD. CCK-8, cell counting kit-8; **p < 0.01, compared with sh-NC group, N = 3.
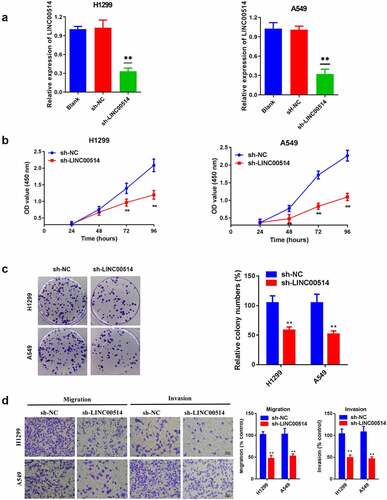
Figure 3. LINC00514 accounted for regulating EMT and Wnt/β-catenin signaling pathway in NSCLC cells. (a) Western-blot showed knockdown of LIN00514 affected EMT and Wnt/β-catenin signaling-related proteins. (b) TCF/LEF1 luciferase activity was suppressed by LINC00514 silencing. Data are presented as the mean ± SD. *p < 0.05, **p < 0.01, ***p < 0.001. compared with sh-NC group, N = 3.
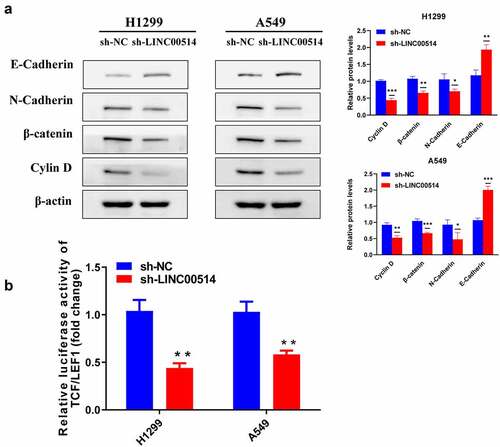
Figure 4. LINC00514 expression led to NSCLC cancer progression by modulating the Wnt/β-Catenin signaling. (a) Colony formation assay showed that silencing LINC00514 resulted in decreased cell proliferation, restored by the Wnt agonist LiCl. (b) Transwell assay further showed that LiCl could recover migration and invasion rate of LINC00514 knockdown H1299/A549 cells. LiCl, Lithium chloride; Data are presented as the mean ± SD. **p < 0.01, compared with sh-NC group; ##p < 0.01, compared with sh-LINC00514 group, N = 3.
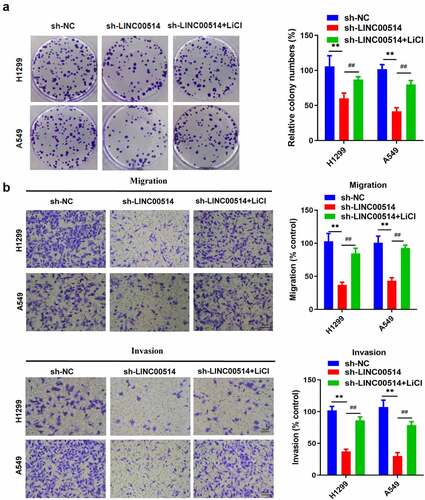
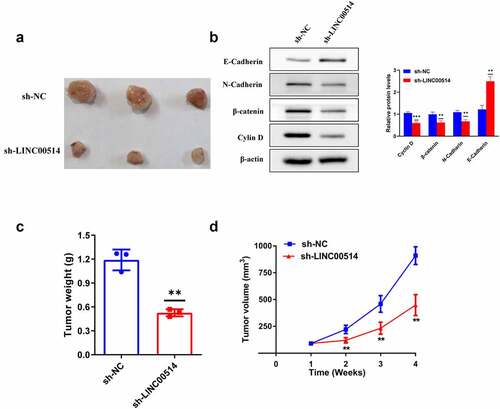
Figure 5. Silencing of LINC00514 attenuated NSCLC tumor growth in vivo. (a) The images of subcutaneous tumors were obtained on Day28. (b) Western-blot showed that knockdown of LINC00514 affected the expression of EMT and Wnt/β-catenin signaling-related proteins in vivo. (C/D) The tumor volumes and weights of the sh-LINC00514/sh-NC group were quantified. Data are presented as the mean ± SD. **p < 0.01, ***p < 0.001. compared with sh-NC group, N = 3.
Data availability statement
The datasets generated or analyzed during this study are available from the corresponding author upon reasonable request.