
Figures & data
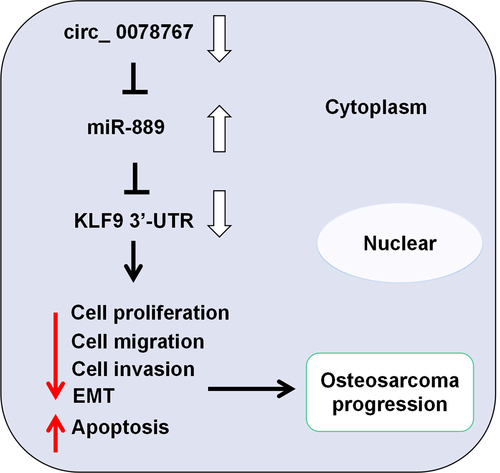
Table 1. Primers used for qRT-PCR.
Table 2. The oligonucleotides transfected in this study are listed as follows.
Table 3. Correlation between patients’ clinicopathological features and circ_0078767 expression in osteosarcoma tissues.
Figure 1. Circ_0078767 is downregulated in OS cells and tissues.
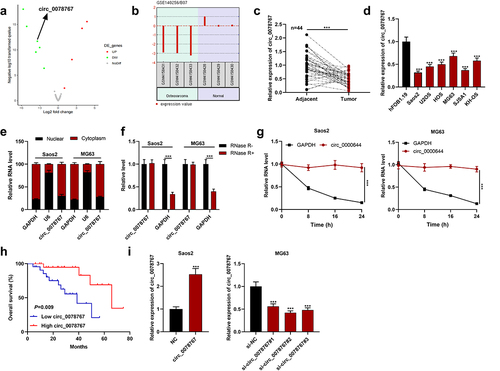
Figure 2. Circ_0078767 restrains OS cell growth, migration, invasion, EMT, and promotes apoptosis.
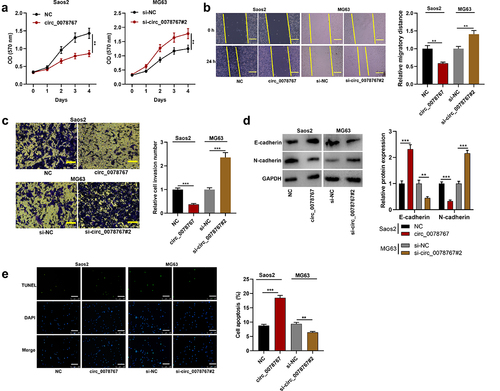
Figure 3. Circ_0078767 targets miR-889.
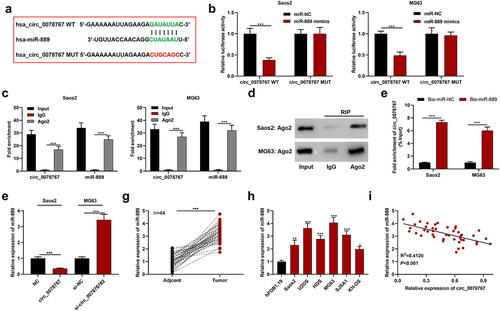
Figure 4. Circ_0078767 represses OS cell growth, migration and invasion via absorbing miR-889.
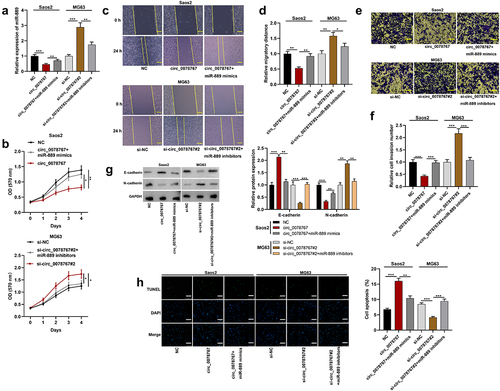
Figure 5. Circ_0078767 upregulates KLF9 through targeting miR-889.
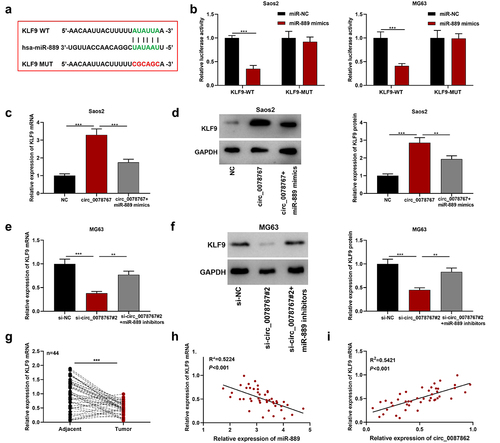
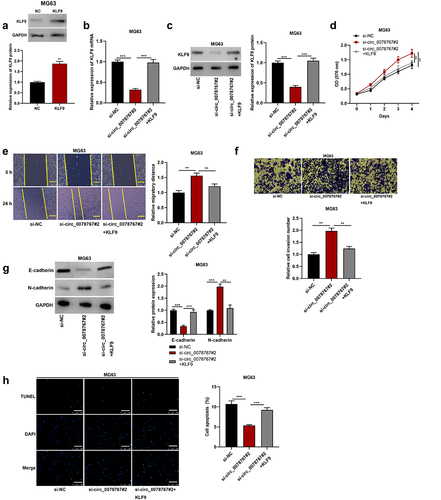
Figure 6. Circ_0078767 inhibits OS progression by regulating KLF9.
Supplemental Material
Download Zip (103 MB)Data availability statement
The data used for supporting the findings of this study are available from the corresponding authors upon request.