
Figures & data
Figure 1. Schematic representation of lentiviral construct and characterization of SmartDC-FRα generated from human primary monocytes. a) Scheme of SmartDC-FRα construct containing tri-cistonic genes encoding GM-CSF, IL-4, and FRα linked with P2A and F2A self-cleaving sequences. PuroR indicates puromycin resistance gene. b) Morphologies of monocytes at day 1, cytokine-driven monocyte-derived DC (Conv-DC), SmartDC-iRFP, and SmartDC-FRα, after 7 days of culture. Scale bars represent 50 µm. c) Lentiviral copy numbers in monocytes, SmartDC-iRFP, and SmartDC-FRα evaluated by qPCR for puromycin resistance gene in lentiviral construct and housekeeping albumin gene. Result summarized from 3 independent experiments. d) GM-CSF cytokine secreted by monocytes, SmartDC-iRFP, and SmartDC-FRα measured by ELISA summarized from 3 independent experiments. e) IL-4 cytokine secreted by monocytes, SmartDC-iRFP and SmartDC-FRα measured by ELISA summarized from 3 independent experiments. (ns indicates not statistically significant, * indicates statistically significant with P-value<0.05, ** indicates statistically significant with P-value<0.01, *** indicates statistically significant with P-value<0.001).
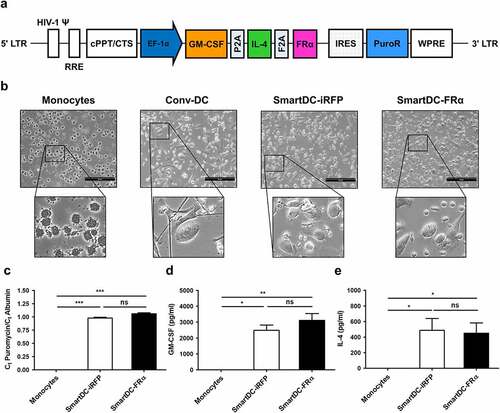
Figure 2. Phenotypic analysis of monocytes, Conv-DC, SmartDC-iRFP and SmartDC-FRα. The cells were stained with specific antibodies and analyzed by flow cytometry (FACS). a) Gating strategy for monocytes and DCs population b) Representatives of histogram from 3 independent experiments showing expression levels of monocyte marker, DC markers, DC maturation markers and co-stimulatory molecules in monocytes, Conv-DC, SmartDC-iRFP, and SmartDC-FRα by FACS. MFI or mean fluorescence intensity are indicated with numbers. c) Percentage of monocyte marker, DC markers, maturation markers and co-stimulatory molecules positive cells in monocytes (white bar), Conv-DC (striped bar), SmartDC-iRFP (gray bar), and SmartDC-FRα (black bar). Results were summarized from 3 independent experiments. (ns indicates not statistically significant, * indicates statistically significant with P-value<0.05, ** indicates statistically significant with P-value<0.01, *** indicates statistically significant with P-value<0.001).
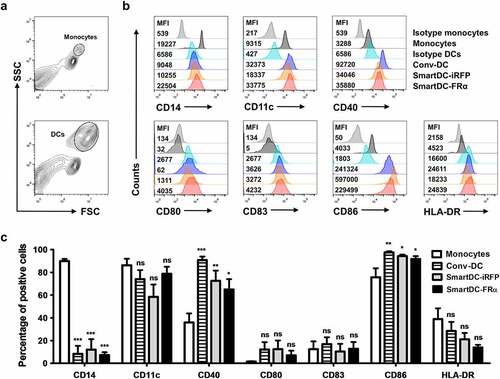
Figure 3. Lymphocyte population and T cell subsets before activation, without activation (or unactivation), and after activation by SmartDC-iRFP or SmartDC-FRα, analyzed by flow cytometry (FACS). Unactivated T lymphocytes (striped bar) were T lymphocytes that were not activated by SmartDC-iRFP or SmartDC-FRα but cultured in cytokine-conditioned medium in the same manner as the activated T cells. a) Lymphocyte populations before activation (white bar) and after activation by SmartDC-iRFP (gray bar) and SmartDC-FRα (black bar). Lymphocytes were sub-populated as helper T cells (Th) (CD3+, CD4+), cytotoxic T cells (Tc) (CD3+, CD8+), B cells (CD3-, CD19+) and NK cells (CD3-, CD56+) based on their cell surface markers. b) T cell subsets before activation (white bar) and after activation by SmartDC-iRFP (gray bar) and SmartDC-FRα (black bar). T lymphocytes were classified as naïve T cells (CD3+, CD62L+, CD45RO-), central memory T cells (Tcm) (CD3+, CD62L+, CD45RO+), effector memory T cells (Tem) (CD3+, CD62L-, CD45RO+), and terminal effector T cells (Ttem) (CD3+, CD62L-, CD45RO-) according to their cell surface markers. The results were summarized from 3 independent experiments. (ns indicates not statistically significant, * indicates statistically significant with P-value<0.05, ** indicates statistically significant with P-value<0.01).
Figure 4. Cytotoxic function of T lymphocytes activated by SmartDC-FRα against cultured BC cell lines examined by luciferase-based assay. Expression of FRα protein in normal breast-like (MCF10A) and breast cancer (MCF-7 and MDA-MB-231) target cell lines examined by immunofluorescence staining with specific anti-FRα antibody were also depicted. Expression FRα protein indicated in green. Nuclei of the cells were stained blue color. Scale bars represent 10 µm. Percentages of specific target cell lyses of unactivated T lymphocytes (white bar), T lymphocytes activated by SmartDC-iRFP (gray bar), and T lymphocytes activated by SmartDC-FRα (black bar) after co-culture with target cells as indicated were shown.; a) normal breast-like MCF10A cells, b) luminal type BC MCF-7 cells, and c) TNBC MDA-MB-231 cells. Results were summarized from 3 independent experiments. T lymphocytes activated by SmartDC-FRα preferentially lysed FRα-expressing BC cells but exhibited low lysis of FRα-negative MCF10A cells at the indicated effector to target (E:T) ratio. (ns indicates not statistically significant, * indicates statistically significant with P-value<0.05, ** indicates statistically significant with P-value<0.01).
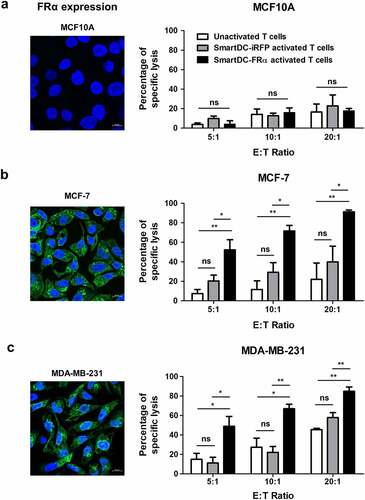
Figure 5. Cytotoxic function of T lymphocytes activated by SmartDC-FRα against cultured BC cell lines examined by fluorescence microscopy (a) and crystalline violet staining (b), and IFN-γ production of T lymphocytes activated by SmartDC-FRα after co-culture with target cells (c). a) The unactivated or activated T lymphocytes were co-cultured with target cell lines expressing mWasabi green fluorescence protein and after co-culturing at effector to target (E:T) ratio of 10:1 for 24 h images were captured by fluorescence microscopy. Target alone indicates target cells without co-culture with the T lymphocytes, unactivated T lymphocytes serve as negative control, and T lymphocytes activated by SmartDC-iRFP are irrelevant DC activation control. Representative images were shown with original magnification of 10x. b) Photograph of crystalline violet staining of target cell lines after co-culture with unactivated T lymphocytes, T lymphocytes activated by SmartDC-iRFP, and T lymphocytes activated by SmartDC-FRα at indicated E:T ratio for 24 h. c) IFN-γ production of unactivated T lymphocytes (white bar), T lymphocytes activated by SmartDC-iRFP (gray bar), and T lymphocytes activated by SmartDC-FRα (black bar) in response to co-culture with target cell lines at E:T ratio of 10:1 for 6 h quantitated by ELISA. Results were summarized from 3 independent experiments.
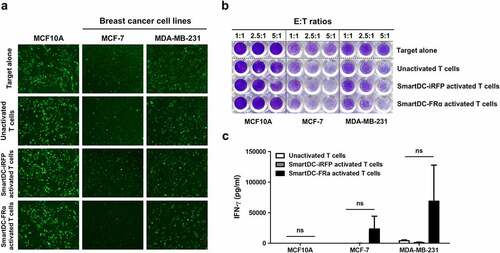
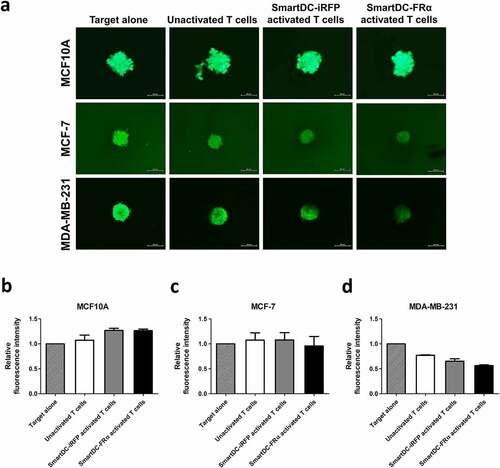
Figure 6. Cytotoxic function of T lymphocytes activated by SmartDC-FRα against BC spheroid cultures examined by fluorescence microscopy. (a) Representative fluorescence spheroid images of target cell lines expressing mWasabi green fluorescence protein were taken after 4 days of coculture with indicated effector cells at an effector to target ratio of 20:1. Target alone indicates target cells without the presence of T lymphocytes. Scale bars indicate 500 µm. Bar graph of relative fluorescence intensity of (b) MCF10A, (c) MCF-7, (d) MDA-MB-231 spheroids after cocultured with unactivated T lymphocytes (white bar), T lymphocytes activated by SmartDC-iRFP (gray bar), and T lymphocytes activated by SmartDC-FRα (black bar). Fluorescence intensity of target cell spheroids alone without cocultured with effector cells were used as control. Data is represented from 2 independent donors.
Supplemental Material
Download Zip (427.2 KB)Data availability statement
The authors confirm that the data supporting the findings of this study are available within the article and its supplementary materials.