
Figures & data

Table 1. Primer sequences used for RT-qPCR
Figure 1. MiR-20a-5p is overexpressed during chondrogenic differentiation. a. Flow cytometry analysis for surface antigen expression of BMSCs. b. Morphological characteristics of BMSCs under a microscope. c. Alcian blue staining for detecting chondrogenic differentiation of BMSCs. d. Western blotting for evaluating protein levels of cartilage genes at 0, 7 and 14 days. e. RT-qPCR analysis of miR-20a-5p level. *p < 0.05, **p < 0.01.
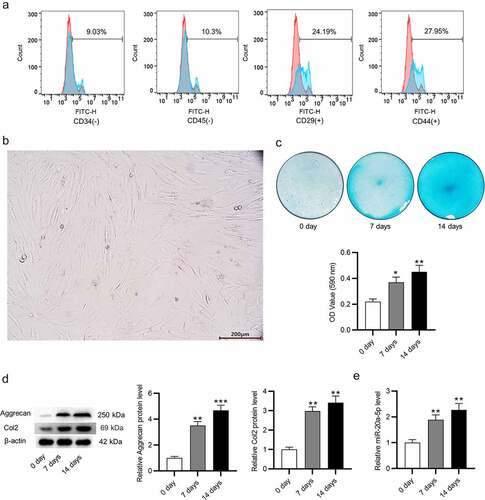
Figure 2. Depletion of miR-20a-5p inhibits chondrogenic differentiation of BMSCs. a. RT-qPCR analysis for detection of transfection efficiency of miR-20a-5p inhibitor. b-c. Alcian blue staining for assessing chondrogenic differentiation of miR-20a-5p inhibitor-transfected BMSCs. d-e. Western blotting for assessing protein levels of cartilage genes (Aggrecan and Col2), catabolic markers (ADAMTS5, MMP13) and hypertrophic chondrocyte marker (Col10) in BMSCs with above transfection. **p < 0.01, ***p < 0.001.
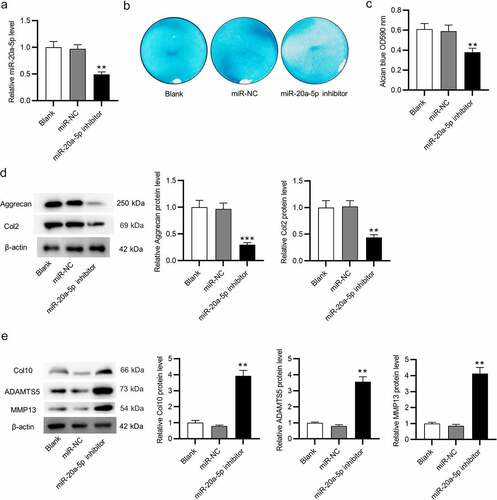
Figure 3. Upregulation of miR-20a-5p ameliorates OA. a. HE staining for histopathological observation of knee articular cartilage. b. Modified Mankin scores assigned to cartilage tissues. c-e. Micro-CT images of the mice in four groups for assessments of BV/TV, Tb. Th, and Tb. Sp. f-g. Western blotting for assessing the protein levels of cartilage markers (Aggrecan and Col2), catabolic markers (ADAMTS5, MMP13) and hypertrophic chondrocyte marker (Col10). **p < 0.01, ***p < 0.001 versus Sham + AAV-NC group; ##p < 0.01 versus Sham + AAV-miR-20a-5p group. n = 10 mice/group.
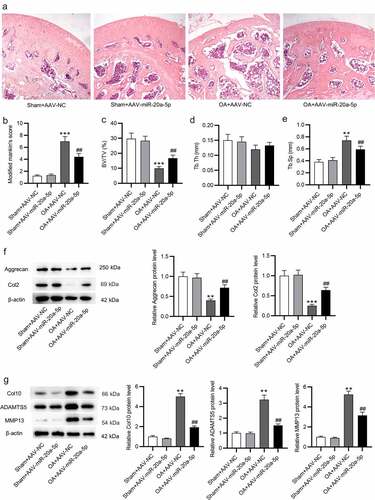
Figure 4. MiR-20a-5p targets Map3k2. a. miRDB used for screening miR-20a-5p target genes. b. RT-qPCR analysis of mRNA levels of the predicted genes in miR-20a-5p-depleted BMSCs. c. Western blotting for assessing Map3k2 protein level in above cells. d. TargetScan for predicting the binding site of miR-20a-5p on Map3k2. e. Luciferase reporter assay for identifying the binding relation between Map3k2 and miR-20a-5p in BMSCs. **p < 0.01, ***p < 0.001.
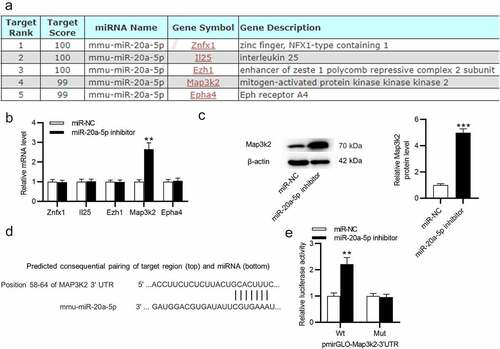
Figure 5. The expression of Map3k2 and miR-20a-5p in murine cartilage tissues was negatively correlated. a-b. RT-qPCR of miR-20a-5p and Map3k2 levels in murine cartilage tissues. c. The expression correlation between Map3k2 and miR-20a-5p analyzed by Pearson analysis. &&p < 0.01 versus Sham + AAV-NC group; **p < 0.01 versus Sham + AAV-NC group; ##p < 0.01 versus OA + AAV-NC group.
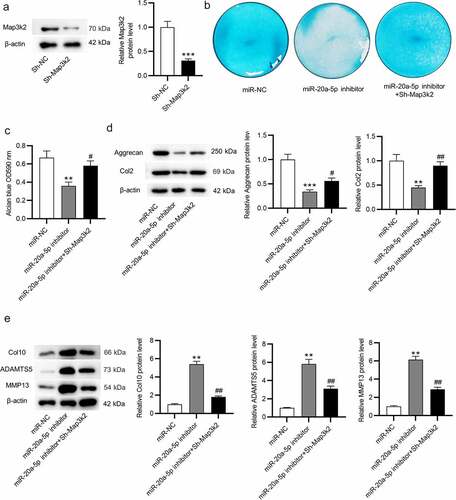
Figure 6. Map3k2 knockdown reverses the suppressive influences of miR-20a-5p inhibition on chondrogenic differentiation. a. Western blotting of Map3k2 protein level in BMSCs transfected with Sh-Map3k2. b-c. Alcian blue staining for examining chondrogenic differentiation of BMSCs transfected with miR-NC, miR-20a-5p inhibitor or miR-20a-5p inhibitor + Sh-Map3k2. d-e. Western blotting of Aggrecan, Col2, ADAMTS5, MMP13 and Col10 protein levels in BMSCs with above transfection. **p < 0.01, ***p < 0.001 versus sh-NC/miR-NC group; #p < 0.05, ##p < 0.01 versus miR-20a-5p inhibitor group.
Supplemental Material
Download PDF (218.4 KB)Data Availability Statement
The datasets used or analyzed during the current study are available from the corresponding author on reasonable request.