
Figures & data
Figure 1. ATP-adenosine signaling levels vary across tumor types of TCGA.
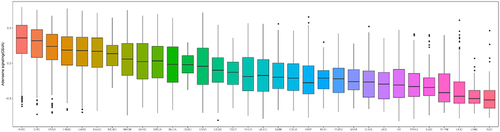
Figure 2. Association of the four-gene score with CRC in the GSE39582 dataset. (a) Violin plot of four-gene (ENTPD1, ENTPD2, ALPP, NT5E) score in normal tissues and CRC tissues (P < 0.05). (b) Kaplan–Meier survival plot of comparison between low four-gene score and high four-gene-score groups for overall survival (P < 0.05).
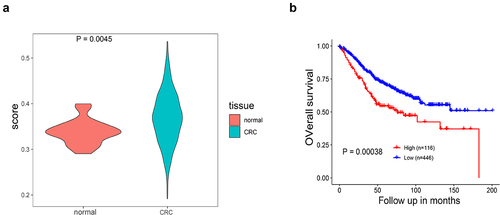
Table 1. Clinical and pathological data of CRC patients.
Figure 3. Levels of serum biomarkers in CRC patients and healthy controls. Levels of serum CEA (a), CA19-9 (b), ATPase (c) and AMPase (d) were elevated in 87 CRC patients compared with 48 healthy controls (*P < 0.05, ***P < 0.001).
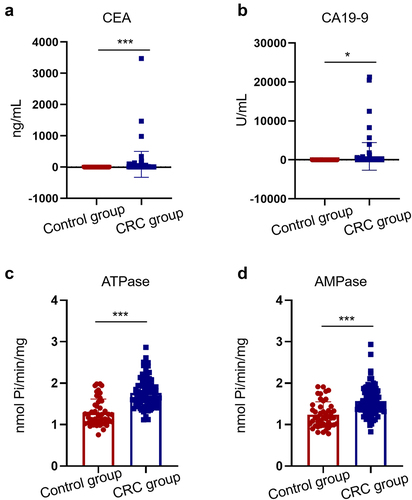
Figure 4. Serum ATPase and AMPase levels are increased in advanced CRC patients. (a, b) The serum ATPase and AMPase levels were upregulated in 47 advanced CRC patients compared with 40 early CRC patients (*P < 0.05).
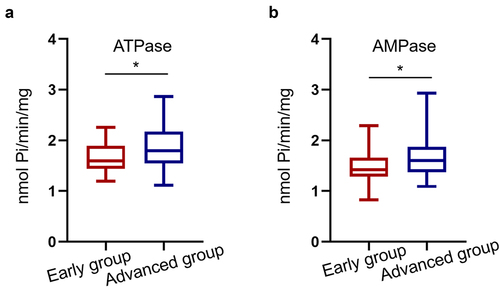
Figure 5. Effect of specific inhibitors of ENTPDases and CD73 on ATPase and AMPase levels in CRC patients. (a) Effect of specific inhibitors of ENTPDases (ARL67153 and POM-1) on ATP hydrolysis (***P < 0.001). (b) Effect of specific inhibitor of CD73 (APCP) on AMP hydrolysis (***P < 0.001).
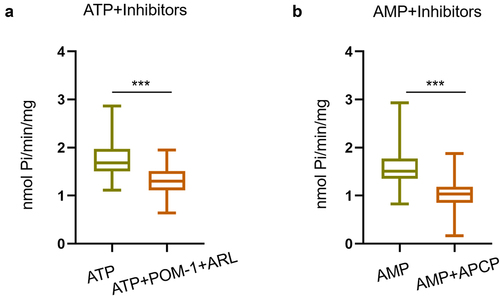
Figure 6. ROC curves of using CEA, CA19-9, ATPase and AMPase alone in CRC patients.
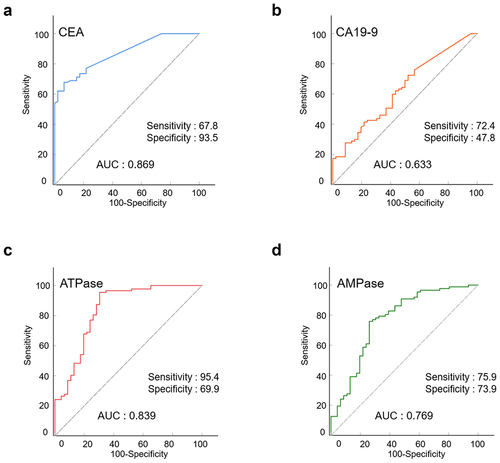
Table 2. The diagnosis value of individual indicator in CRC detection.
Figure 7. ROC curves of using CEA, CA19-9, ATPase and AMPase in combination in CRC patients.
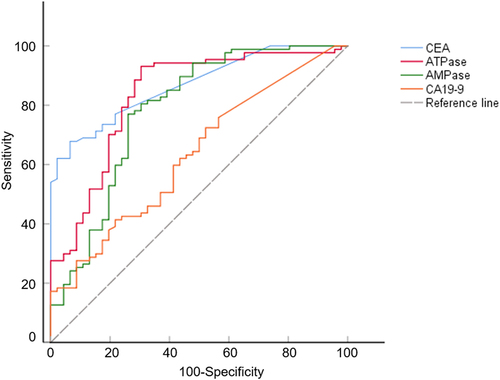
Table 3. The diagnosis value of CEA, CA19-9, ATPase and AMPase in combination to diagnose CRC.