
Figures & data
Table 1. The gene primers of the qRT-PCR analyses.
Figure 1. Efficiency detection of KLF10 interference (a) and over expression (b) in osteoblasts by quantitative real‐time polymerase chain reaction.
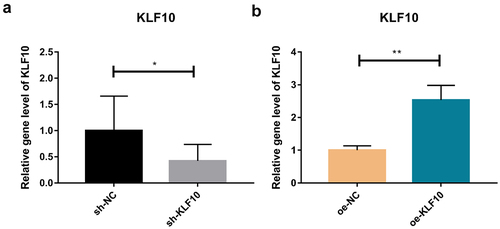
Figure 2. The effect of insulin on proliferation (a) and differentiation (b) of osteoblasts.
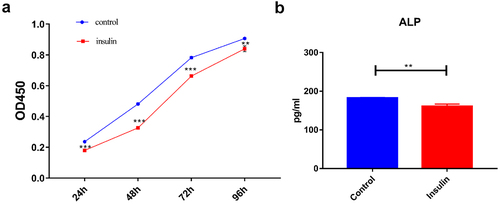
Figure 3. The effect of KLF10 over expression on proliferation (a) and differentiation (b) of osteoblasts.
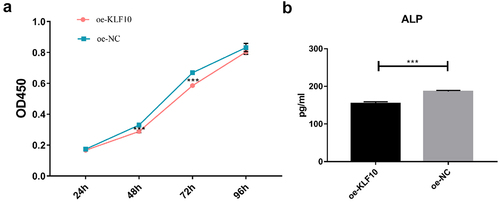
Figure 4. The effect of KLF10 knockdown and insulin on proliferation (a) and differentiation (b) of osteoblasts.
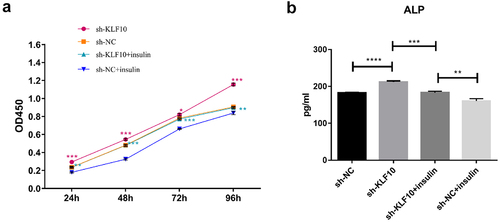
Figure 5. The effect of insulin on mRNA expression of KLF10, ON, OPG and RANKL.
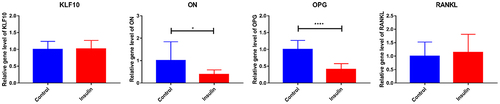
Figure 6. The effect of KLF10 over expression on mRNA expression of ON, OPG and RANKL.
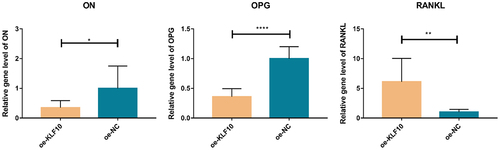
Figure 7. The effect of KLF10 knockdown and insulin on mRNA expression of KLF10, ON, OPG, and RANKL.
Figure 8. The effect of insulin and KLF10 on protein expression of AKT and NF-kB.
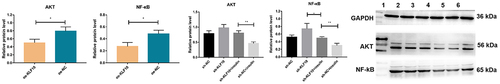
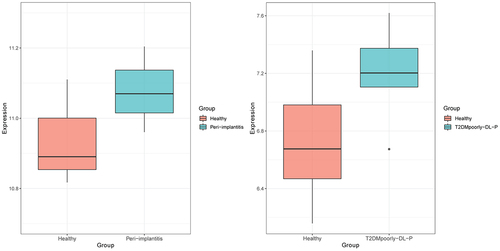
Figure 9. Expression box plot of KLF10 in patients with periodontitis and type 2 diabetes mellitus with periodontitis.
Supplemental Material
Download Zip (1.9 MB)Data availability statement
All data are available in the article.