Figures & data
Figure 1. Dorsal skinfold window-chamber assembling on BABL/C nude mice.
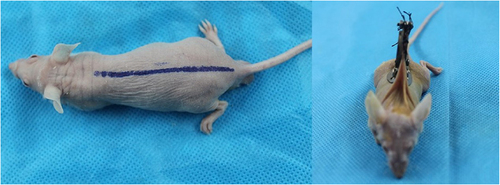
Figure 2. Implanting of OECs-DBM complex and illustration of implanting layers.
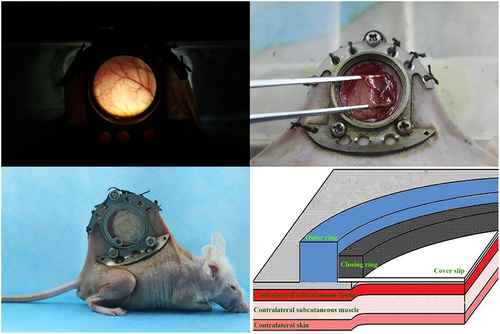
Figure 3. Observation platform for nude mice burdening dorsal skinfold window-chamber.
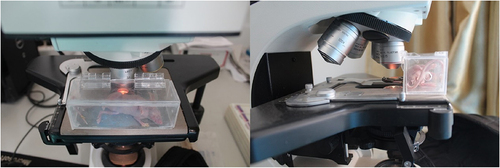
Figure 4. Determination of time window for observation of vascularization. Scale bar: 1 mm.
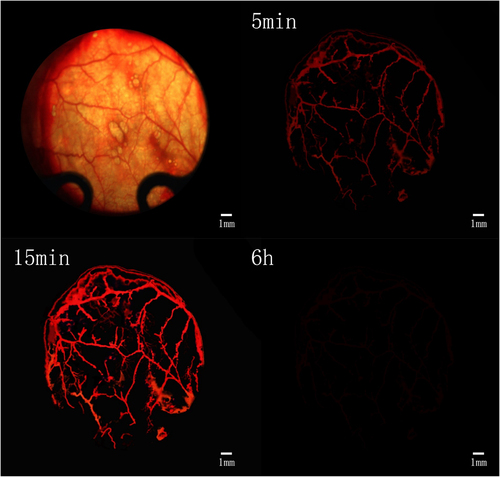
Figure 5. Observation and fluorescent imaging of microvessels. a: Microvessels under light microscopy prior to injection of Texas red-dextran; b: Microvessels under light microscopy after injection of Texas red-dextran; c: Microvessels under fluorescence microscope after injection of Texas red-dextran. Scale bar: 100 μm.
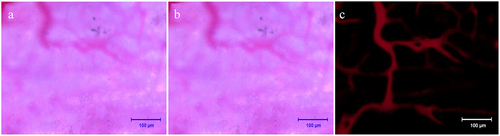
Figure 6. Dynamic observation of vascularization in OECS-DBM complex. a: Ingrowth of recipient microvessels across the verge of OECs-DBM complex. Scale bar: 100 μm. Dot line represents verge of OECs-DBM complex, white arrow represents recipient microvessel grows into OECs-DBM complex. b: Number of ingrown microvessels–time curve. Compare with OECs-DBM scaffold under dynamic culture, *P < 0.05.
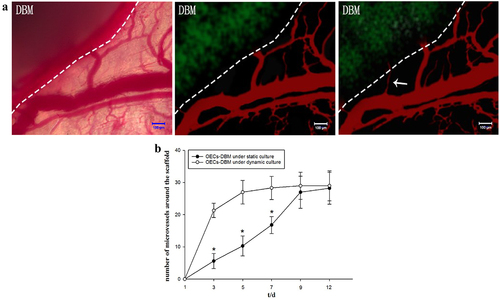
Figure 7. OECS-DBM complex was observed in static culture and dynamic culture group. a: In vivo observation and fluorescent imaging of OECs-DBM complex under static culture (left) and dynamic culture (right). Scale bar: 1 mm. b: Integrated density of scaffold border–time curve. c: Integrated density of scaffold central area–time curve. Compare with OECs-DBM scaffold under dynamic culture, *P < 0.05, **P < 0.01.
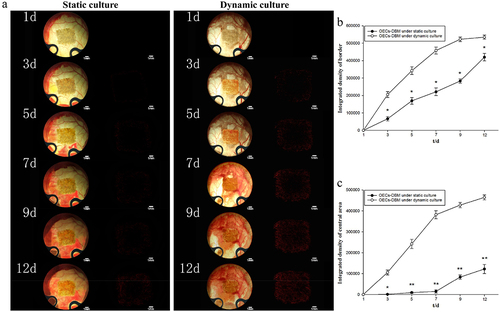
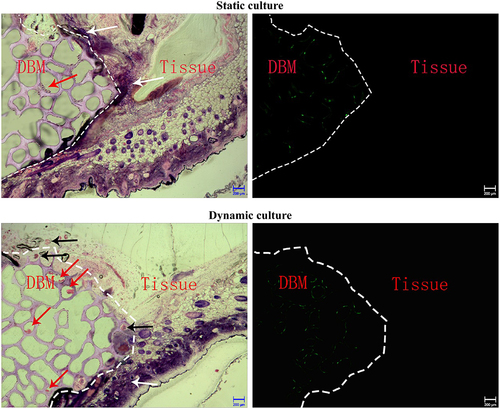
Figure 8. HE staining and fluorescent imaging of OECs-DBM scaffold slice under static culture and dynamic culture. Dot line represents verge of scaffold, red arrow represents OECs lumps, white arrow represents inflammatory cells, black arrow represents microvessels from recipient. Scale bar: 200 μm.