
Figures & data
Figure 1. BAIBA attenuates the phenotypic transformation, proliferation and migration of SHR-derived VSMCs. (a) VSMCs were treated with various doses of BABAI for 48 h, and the proliferation of VSMCs was determined by CCK-8. (b) EdU-positive cells measured with Edu incorporation assay. Scale bar = 100 μm. (c) Relative EdU-positive cells. (d) Represented blots and relative quantification of PCNA. (e) Relative mRNA levels of αsma, Sm22α, and Opn. (f, g) Effects of curcumin (BAIBA) on VSMC migration measured with Boyden chamber assay. Scale bar = 200 μm (h) Represented blots and relative quantification of MMP-2 and MMP-9. Values are mean ± S.E. * P < 0.05 vs. WKY, † P < 0.05 vs. SHR. n = 4–5 for each group.
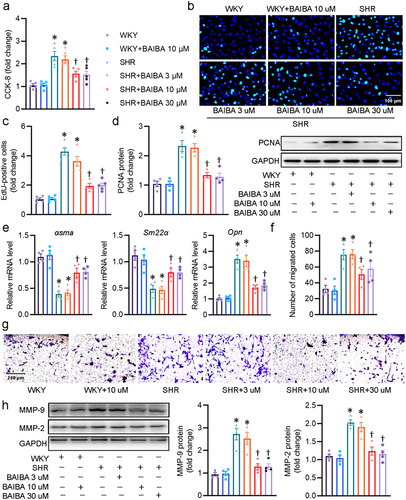
Figure 2. BAIBA attenuates VSMC inflammation in SHR-derived VSMCs. (a) Represented blots and relative quantification of TNF-α, IL-1β, MCP-1, and IL-6. (b) Relative mRNA levels of Tnfα, Il1β, Mcp1, and Il6. (c) ELISA assays for TNF-α, IL-1β, MCP-1, and IL-6. (d) Represented blots and relative quantification of phosphorylated p65 NF-κB, IκBα, and phosphorylated IκBα. (e) Represented blots and relative quantification of p65 NF-κB in the cytoplasm and nucleus. (f) Represented blots and relative quantification of phosphorylated STAT3. Values are mean ± S.E. * P < 0.05 vs. WKY, † P < 0.05 vs. SHR. n = 4–5 for each group.
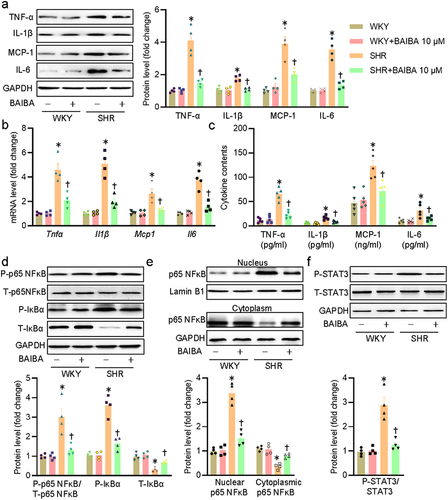
Figure 3. BAIBA attenuates VSMC oxidative stress in SHR-derived VSMCs. (a) Represented blots and relative quantification of NOX1, NOX4, p47phox, and membrane p47phox. (b) Represented images and relative quantification of DHE. Scale bar = 150 μm. (c) SOD activities. (d) MDA contents. (e, g) Represented blots and relative quantification of nuclear Nrf-2 and Keap1. (f, h) Cell lysates were immunoprecipitated with an anti-Keap1 antibody and blotted with an anti-Nrf2 antibody. (i) Immunofluorescence images of Nrf-2. Scale bar = 200 μm. (j) Relative mRNA levels of Ho1, Nqo1, Gclc, and Gclm. Values are mean ± S.E. * P < 0.05 vs. WKY, † P < 0.05 vs. SHR. n = 4–5 for each group.
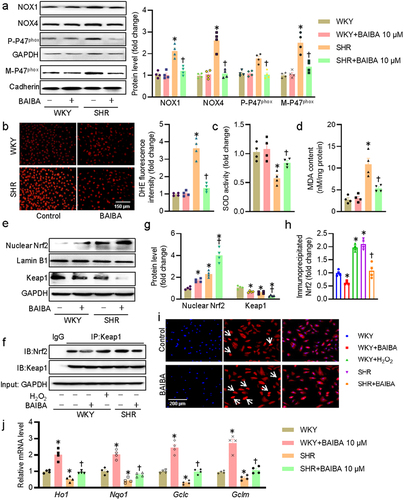
Figure 4. BAIBA activates the LKB1/AMPK/SIRT1 axis to suppress p65 NF-κB and STAT3 acetylation. (a) Effects of BAIBA (10 μM) on the phosphorylation levels of AMPK. (b) Represented blots and relative quantification of P-AMPK and SIRT1. (c) Represented blots and relative quantification of acetylated p65 NF-κB and STAT3. (d) VSMCs were pretreated with STO-609 (0.8 μM) for 30 min, and then were challenged by BAIBA (10 μM) for 30 min to determine the phosphorylated AMPK, and for 48 h to determine the SIRT1 protein expression. (e) VSMCs were pretreated with Takinib (10 mM) for 30 min, and then were challenged by BAIBA (10 μM) for 30 min to determine the phosphorylated AMPK, and for 48 h to determine the SIRT1 protein expression. (f) VSMCs were transfected with LKB1 siRNA (100 nM) for 24 h, and then were challenged by BAIBA (10 μM) for 30 min to determine the phosphorylated AMPK, and for 48 h to determine the SIRT1 protein expression. Values are mean ± S.E. * P < 0.05 vs. 0 min or WKY, † P < 0.05 vs. SHR, # P < 0.05 vs. SHR+BAIBA. n = 4 for each group.
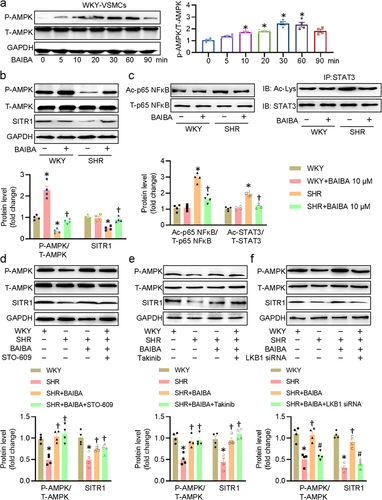
Figure 5. Inhibition of AMPK/SIRT1 axis abolishes the effects of BAIBA on VSMCs. (a) VSMCs were transfected with AMPKα1 siRNA (100 nM) or treated with EX-527 (10 μM) for 24 h, and then were challenged by BAIBA (10 μM) for 48 h. The proliferation and migration of VSMCs were assessed by EdU staining (upper, scale bar = 100 μm) and transwell assay (lower, scale bar = 200 μm). (b) Represented blots and relative quantification of PCNA, MMP-2, and MMP-9. (c) MDA contents and SOD activities. (d) Relative mRNA levels of Tnfα and Il1β. Values are mean ± S.E. * P < 0.05 vs. WKY, † P < 0.05 vs. SHR, # P < 0.05 vs. SHR+BAIBA. n = 4–5 for each group.
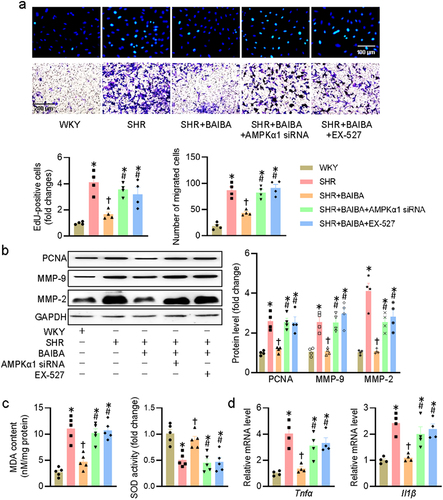
Figure 6. Activation of AMPK/SIRT1 signaling is required for BAIBA ameliorates hypertension-related vascular remodeling and oxidative stress in SHR. (a) Systolic blood pressure (SBP), diastolic blood pressure (DBP), mean arterial pressure (MAP) and heart rate (HR) in conscious state. (b, d) Representative photographs and quantitative analysis of aortas by HE staining. Scale bar = 100 μm. (c, e) Representative photographs and quantitative analysis of aortas by DHE staining. Scale bar = 100 μm. (f) Represented blots and relative quantification of PCNA and NOX1. Values are mean ± S.E. * P < 0.05 vs. 0 min or WKY, † P < 0.05 vs. SHR, # P < 0.05 vs. SHR+BAIBA. n = 4–6 for each group.
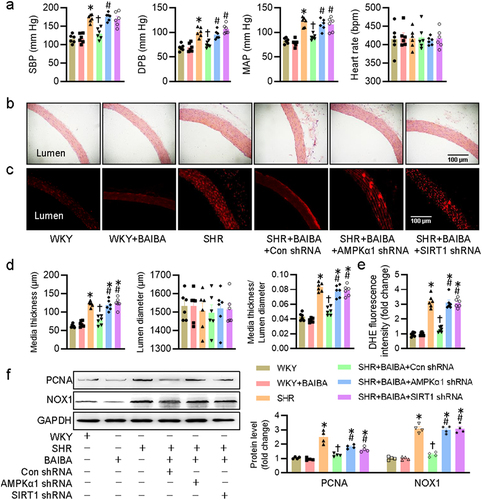
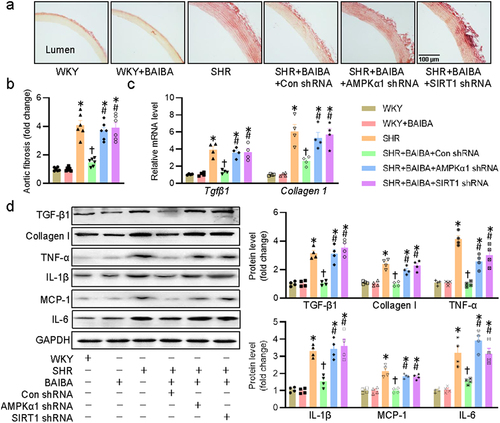
Figure 7. Activation of AMPK/SIRT1 signaling is required for BAIBA ameliorates hypertension-related vascular fibrosis and inflammation. (a, b) Representative photographs and quantitative analysis of aortas by sirius red staining. (c) Relative mRNA levels of Tgfβ1 and Collagen1. (d) Represented blots and relative quantification of TGF-β1, collagen I, TNF-α, IL-1β, MCP-1, and IL-6. Values are mean ± S.E. * P < 0.05 vs. 0 min or WKY, † P < 0.05 vs. SHR, # P < 0.05 vs. SHR+BAIBA. n = 4–6 for each group.
Supplemental Material
Download MS Word (461.6 KB)Data availability statement
The data analyzed during the current study are available from the corresponding author on reasonable request.