
Figures & data
Figure 1. Changes in charge variant distribution during for mAb 1 during clarified cell culture fluid hold. a) Capillary Isoelectric Focusing results before and after 6 day hold at 25°C b) acidic peak (%) by Capillary Isoelectric Focusing as a function of CCCF hold time and temperature. (circle – 4°C, diamond – 12°C, triangle – 25°C, square −37°C) c) Correlation between acidic peak (%) by Capillary Isoelectric Focusing and glycation (%) by Quadrupole time-of-flight (Q-TOF) mass spectrometry.
Table 1. Peptide mapping results for mAb1 before and after a 6 day hold at either 25°C or 37°C.
Figure 2. mAb2 and mAb3 changes in charge variant distribution during clarified cell culture fluid hold CIEF are similar to mAb1. Acidic peak (%) by Capillary Isoelectric Focusing as a function of CCCF hold time and temperature (circle – 4°C, diamond – 12°C, triangle – 25°C, square −37°C)for mAb 2 (a) and mAb 3 (c). Correlation between acidic peak (%)by Capillary Isoelectric Focusing and glycation (%) by Quadrupole time-of-flight (Q-TOF) mass spectrometry for mAb2 (b) and mAb 3 (d).
Table 2. Relative increase in glycation level after clarified cell culture fluid hold at 37°C.
Figure 3. Crystal structure of an IgG with LC K188 (yellow), LC K183 (green) and HC K326 (red) highlighted (1HZH – https://www.rcsb.org/structure/1HZH).
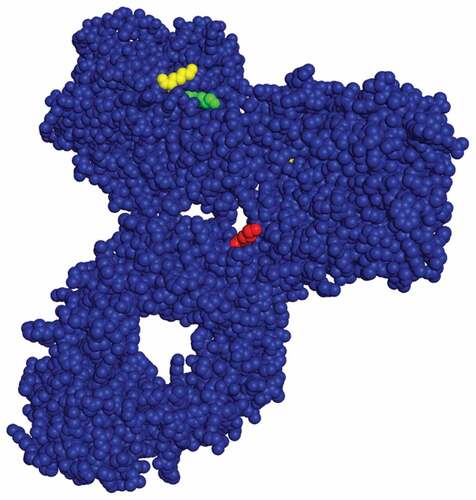
Table 3. mAb3 mutants generated for this study.
Figure 4. Acidic peak (%) by capillary isoelectric focusing as a function of CCCF hold time and temperature (circle – 4°C, diamond – 12°C, triangle – 25°C, square −37°C) for mAb 3 Mutants.
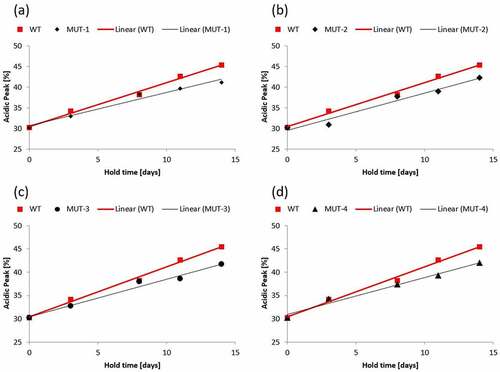
Figure 5. Characterization results for mutant 1. Total purity by Non-reduced (a) and Reduced (b) BioA show no significant difference in stability between mAb3 and Mutant 1. Rate of aggregate formation (c) is slightly higher for Mutant 1. Presented are amount of total glycation (d), heavy chain glycation (e) and light chain glycation (f) during clarified cell culture fluid holds for both mAb3 and Mutant #1. The total glycation and light chain glycation are reduced which is consistent with the targeted mutation of a single light chain lysine.
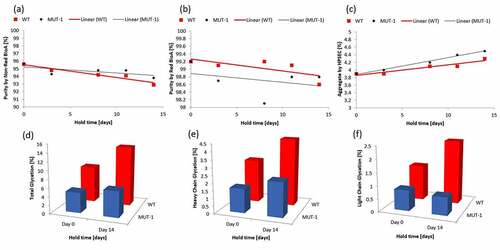
Table 4. Bioassay results for mAb3 and mutant 1, before and after 14 day hold at 25°C.