
Figures & data
Figure 1. NLRC5 was upregulated in NSCLC tissues and cell line. (a and b) The relative mRNA and protein expressions of NLRC5 in NSCLC tumor and adjacent normal tissues. ** means P < 0.01 vs normal tissues. (c) The relative mRNA expression of NLRC5 in different stage of NSCLC tumors. (d and e) The relative mRNA and protein expressions of NLRC5 in BESA-2B cell line and NSCLC cell lines (A549, HCC-827, NCI-H1650, NCI-H1299, NCI-H23). ** means P < 0.01 vs BESA-2B cell line.
Figure 2. Knockdown of NLRC5 mediated tumor suppressive effects on NSCLC cells. (a and b) The relative mRNA and protein expressions of NLRC5 in A549 cell line transfected with siCtrl, siNLRC5-1 or siNLRC5-2. (c) The cell viability was examined by CCK-8 assay in A549 cells with or without NLRC5 knockdown. (d) Flow cytometry analysis for cell apoptosis in A549 cells with or without NLRC5 knockdown. (e) The relative cell apoptosis related protein expressions were detected by western blot assay. (f) Cell invasion was determined by Transwell Matrigel invasion assays in A549 cells with or without NLRC5 knockdown. (g) Wound healing assay was applied to detected cell migration in A549 cells with or without NLRC5 knockdown. ** means P < 0.01 vs Control group.
Figure 3. Knockdown of NLRC5 enhanced the chemosensitivity of A549 cells to carboplatin. (a) The relative mRNA expression of NLRC5 in 12 carboplatin-sensitive and 18 carboplatin-resistant NSCLC tissues. ** means P < 0.01 vs sensitive tissues. (b and c) The relative mRNA and protein expressions of NLRC5 in BESA-2B, A549, A549/R, H1650 and H1650/R cell lines. ** means P < 0.01 vs BESA-2B cell line, ## means P < 0.01 vs A549 cell line, && means P < 0.01 vs H1650 cell line. (d) The relative expression of NLRC5 in A549/R and H1650/R transfected with siCtrl, siNLRC5-1 or siNLRC5-2. ** means P < 0.01 vs A549/R cell line transfected with siCtrl. ## means P < 0.01 vs H1650/R cell line transfected with siCtrl. (e) The inhibitory rate of cells treated with different concentrations of carboplatin for 48 h. ** means P < 0.01 vs A549/R or H1650/R cell lines. (f) The IC50 for carboplatin was calculated using GraphPad Prism. ** means P < 0.01 vs A549/R cell line; ## means P < 0.01 vs H1650/R cell line. (g) The relative protein expression of P-gp and MDR1 in carboplatin-resistant cell lines with or without NLRC5 knockdown. ** means P < 0.01 vs A549/R cell line; ## P < 0.01 vs H1650/R cell line.
Figure 4. NLRC5 activated PI3K/AKT signaling pathway by regulating CEACAM1. (a and b) The relative expressions of CEACAM1 in NSCLC tumor and adjacent normal tissues. ** means P < 0.01 vs normal tissues. (c and d) The relative of mRNA and protein expression in A549 cell line with or without NLRC5 knockdown. ** means P < 0.01 vs BEAS-2B cell line. ## means P < 0.01 vs control group. (e and f) The relative expression of CEACAM1 in A549 cell line transfected with siCtrl, siCEACAM1, pcDNA3.1, pcCEACAM1. ** means P < 0.01 vs control group. (g) The relative expression of PI3K/AKT signaling related proteins. ** means P < 0.01 vs control group.
Figure 5. NLRC5 mediated NSCLC progression and chemoresistance to carboplatin by activating PI3K/AKT via regulating CEACAM1. (a) Cell viability was detected by CCK-8 assay in A549 cells. (b) Flow cytometry analysis for cell apoptosis in A549 cells. (c) Relative cell apoptosis related protein expressions were detected by western blot assay. (d) Cell invasion was determined by Transwell assays in A549 cells. (e) Wound healing assay was applied to detected cell migration in A549 cells. (f) The inhibitory rate of cells treated with different concentrations of carboplatin for 48 h. (F) The IC50 for carboplatin was calculated using GraphPad Prism. (g) The relative protein expression of P-gp and MDR1 in carboplatin-resistant cell lines. ** means P < 0.01 vs control group, ## means P < 0.01 vs pcCEACAM1 group.
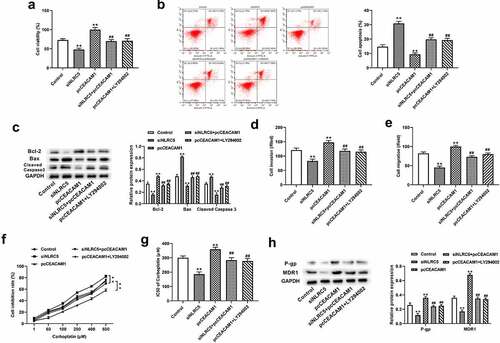
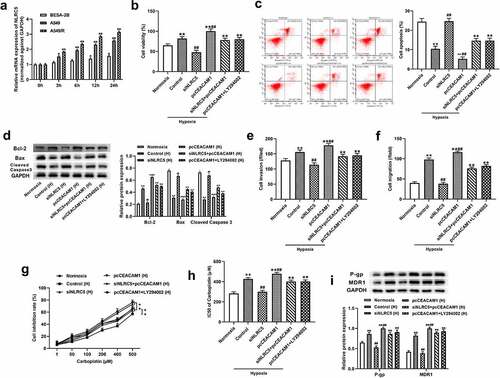
Figure 6. NLRC5 mediated hypoxia-induced NSCLC progression and chemoresistance to carboplatin by activating PI3K/AKT via regulating CEACAM1. (a) The relative expression of NLRC5 in BESA-2B, A549, A549/R cell lines cultured under hypoxia condition for 0 h,3 h,6 h, 12 h, 24 h. ** means P < 0.01 vs BESA-2B cell line. ** P < 0.01 vs BEAS-2B cell line. (b) Cell viability was detected by CCK-8 assay in A549 cells cultured under normoxia and hypoxia condition. ** means P < 0.01 vs Normoxia group, ## means P < 0.01 vs control group. (c) Flow cytometry analysis for cell apoptosis in A549 cells. cultured under normoxia and hypoxia condition. ** means P < 0.01 vs Normoxia group, ## means P < 0.01 vs control group. (d) Relative cell apoptosis related protein expressions were detected by western blot assay in A549 cells. (e) Cell invasion was determined by Transwell assays in A549 cells cultured under normoxia and hypoxia condition. ** means P < 0.01 vs Normoxia group, ## means P < 0.01 vs control group. (f) Wound healing assay was applied to detected cell migration in A549 cells cultured under normoxia and hypoxia condition. ** means P < 0.01 vs Normoxia group, ## means P < 0.01 vs control group. (g) The inhibitory rate of cells treated with different concentrations of carboplatin for 48 h in A549/R cell line cultured under normoxia or hypoxia condition. ** means P < 0.01 vs control group . (h) The IC50 for carboplatin was calculated using GraphPad Prism. ** means P < 0.01 vs control group. (i) The relative protein expression of P-gp and MDR1 in A549/R cell lines. ** means P< 0.01 vs Normoxia group, ## means P < 0.01 vs control group.
Supplemental Material
Download Zip (3 MB)Data availability statement
The data used to support the findings of this study are available from the corresponding author upon request.