Figures & data

Figure 1. Venn diagram of PNS target genes and differentially expressed genes in RA.
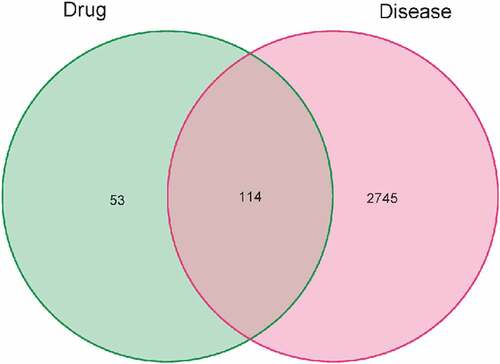
Figure 2. The PNS–compound–target network.
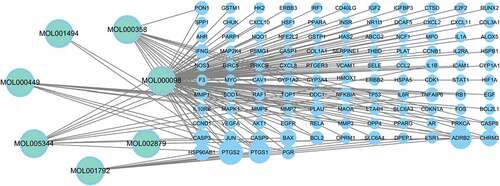
Figure 3. PPI network construction.
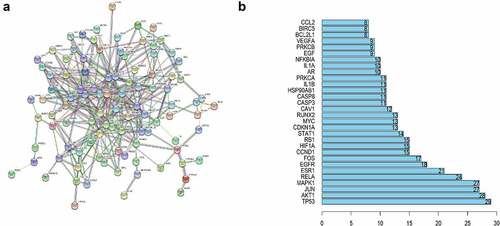
Figure 4. Gene ontology terms of the candidate targets of PNS against RA.
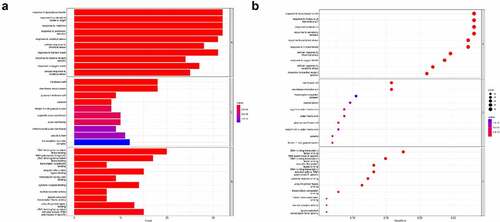
Figure 5. KEGG pathway enrichment of the candidate targets of PNS against RA.
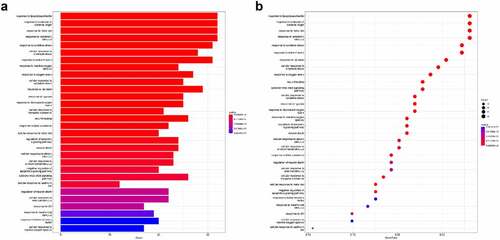
Figure 6. PNS stimulates HUVEC proliferation.
Figure 7. HUVEC migration is aided by PNS. PNS (6.25 mg/L) or DMEM (control) was used to treat the cells. (a) The Boyden chamber test was used to evaluate HUVEC invasive abilities, 10× magnification. (b) The scratch assay was used to evaluate HUVEC migration capacities, 10× magnification. (c and d) HUVEC mobility was measured quantitatively after several treatments. The mean and standard error of the mean of three separate experiments are used to represent the data. *P < 0.05 compared to the control group.
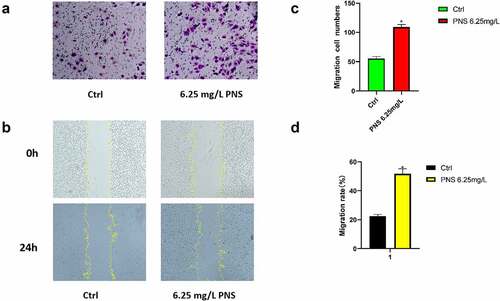
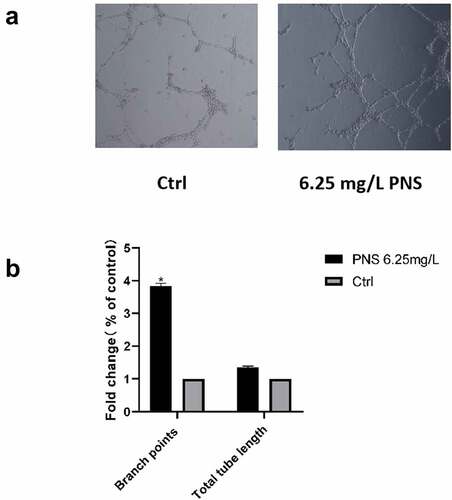
Figure 8. PNS enhances the ability of HUVECs to create capillaries. (a) Photomicrographs of HUVECs planted on Matrigel-coated plates after an 8-hour incubation period with vehicle or PNS (positive control), 10× magnification. (b) When compared to cells in the control group, cells treated with PNS had considerably more branch points. The mean and standard error of the mean of three separate experiments are used to represent the data. *P < 0.05 compared to the control group.