Figures & data
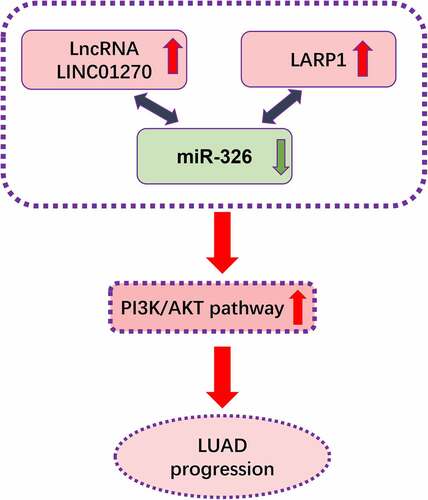
Table 1. The sequences used in this study.
Figure 1. LINC01270 was highly expressed in LUAD tissues and cell lines. Upregulation of LINC01270 was found in LUAD tissues (a) and LUAD cell lines (b). The 5-year overall survival rate in patients with LINC01270 overexpression was lower versus those with LINC01270 downregulation (c). **p < 0.01, ***p < 0.001.
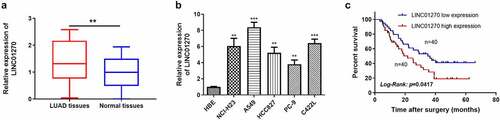
Table 2. The clinicopathological characteristics analysis of LINC01270 expression in LUAD patients.
Figure 2. LINC01270 knockdown resulted in impaired LUAD cell growth and invasion. (a) LINC01270 knockdown in A549 was detected via qRT-PCR. The depressed cell growth ability in LINC01270 knockdown cells was detected via CCK-8 (b), EdU assay (c), and colony formation assay (d). Transwell assay explored the inhibited cell invasion (e) and migration (f) of LINC01270 knockdown cells. **p < 0.01, ***p < 0.001.
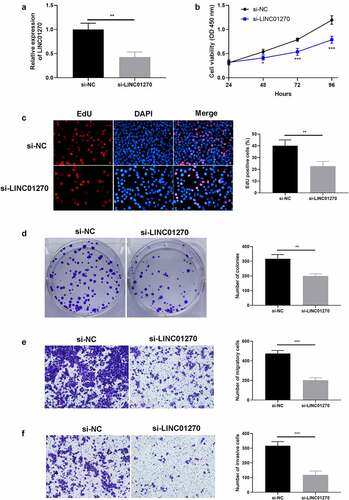
Figure 3. Aberrant overexpression of LINC01270 led to LUAD progression. (a) Upregulation of LINC01270 in PC-9 cells was detected via qRT-PCR. The enhanced cell growth ability in LINC01270 upregulation cells was detected via CCK-8 (b), EdU assay (c), and colony formation assay (d). Transwell assay showed the promoted cell invasion (e) and migration (f) of LINC01270 upregulation cells. *p < 0.05, **p < 0.01, ***p < 0.001.
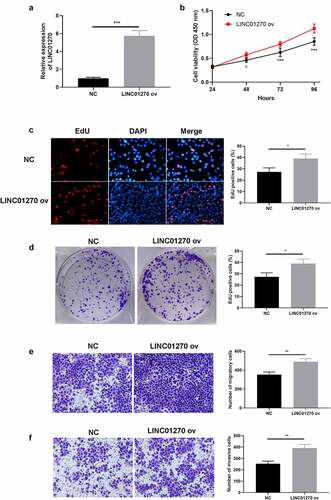
Figure 4. In vivo study of LINC01270 on LUAD was observed. Tumor size of LUAD with si-LINC01270 transfection (a) was smaller while LINC01270 ov transfection group showed bigger tumor size (b). The average tumor volume of LUAD with si-LINC01270 or LINC01270 ov transfection was continuously measured in 21-days. The average tumor weight of LUAD si-LINC01270 or LINC01270 ov transfection was scored after 21-days.
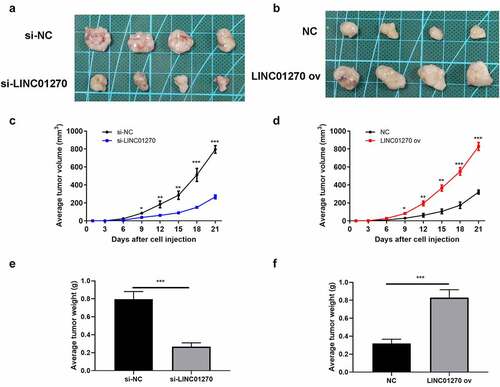
Figure 5. Mir-326 interacted with LINC01270, that is a participant in regulating LUAD. (a) Bioinformatics analysis showed the existence of a complementary sequence between miR-326 and LINC01270. (b) The interaction of miR-326 and LINC01270 was proved by dual-luciferase activity assay. (c) Mir-326 was downregulated in LUAD tissues. (d) Negative correlation between LINC01270 and miR-326 expression. (e) Mir-326 was downregulated in LUAD cell lines. **p < 0.01, ***p < 0.001.
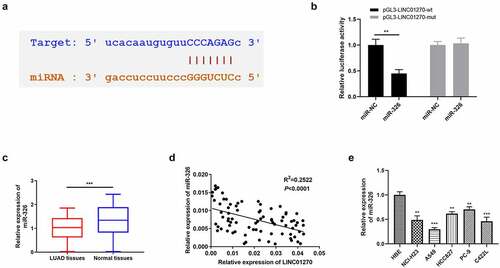
Table 3. The clinicopathological characteristics analysis of miR-326 expression in LUAD patients.
Figure 6. Inhibition of mir-326 restored cell growth and invasion, which was depressed via LINC01270 knockdown. (a) Mir-326 expression was detected via qRT-PCR. The depressed cell growth ability in LINC01270 knockdown cells was restored when giving miR-326 inhibition, which was detected via CCK-8 (b), EdU assay (c), and colony formation assay (d). Transwell assay explored the inhibited cell invasion (e) and migration (f) in LINC01270 silencing cells but augmented invasion when treated with miR-326 inhibitor. *p < 0.05, **p < 0.01, ***p < 0.001.
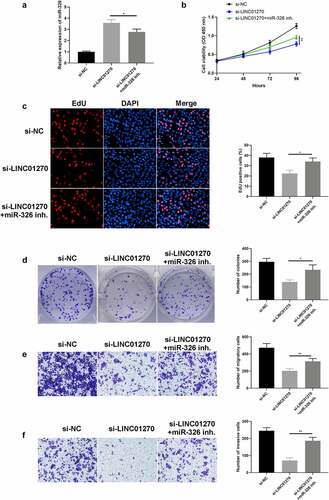
Figure 7. LARP1 interacted with miR-326. (a-b) RIP experiment showed that miR-326 directly targeted LARP1. (c) The complementary sequence was found in miR-326 and LARP1. (d) The existence of interaction between miR-326 and LARP1 was confirmed by the dual-luciferase assay. (e) Negative correlation between LARP1 and miR-326 expression. (f) Aberrant upregulation of LARP1 was shown in LUAD tissues by western blot. **p < 0.01.
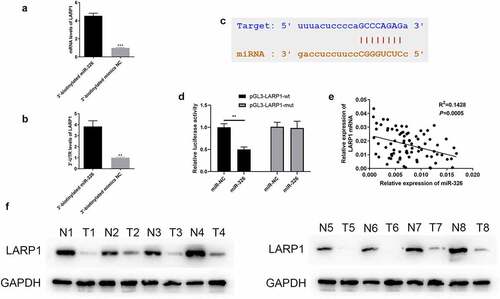
Table 4. The clinicopathological characteristics analysis of LARP1 mRNA expression in LUAD patients.
Figure 8. Overexpression of LARP1 conferred LUAD progression. (a) The expression of LARP1 was examined in the different treated groups. The depressed cell growth ability in mir-326 mimics treated cells was restored when upregulating LARP1, which was detected via CCK-8 (b), EdU assay (c), and colony formation assay (d). Transwell assay explored the inhibited cell invasion (e) and migration (f) in mir-326 mimics treated cells yet enhanced invasion when LARP1 was overexpressed. *p < 0.05, **p < 0.01.
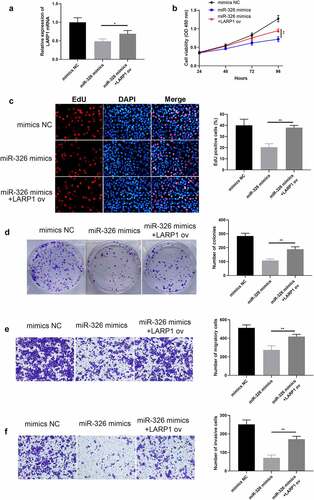
Figure 9. Western blot results demonstrated up-regulation of LARP1, p-PI3K, p-AKT, Bcl-2, and CyclinD1 in the LINC01270 overexpression group, while the proteins were down-regulated in the si-LINC01270 group.