Figures & data
Table 1. Patients’Information
Table 2. Primer Sequences
Figure 1. Aging promoted liver injury and inflammation mediated by macrophages in humans post I/R. Serum levels of ALT and AST detected by biochemical measurements in young and elderly patients post liver transplantation (a). TNF-α and IFN-γ (b) and IL-10 and TGF-β (c) expression was measured by ELISA. Data are presented as the mean ± SEM and performed by one-way analysis, P values <0.05 (two-tailed) were considered statistically significant.
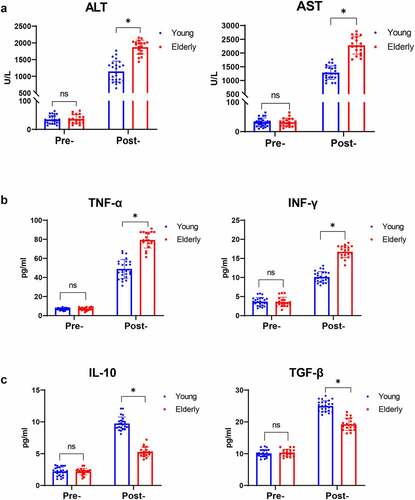
Figure 2. Aging aggravated liver injury and suppressed macrophage anti-inflammatory function in I/R‐stressed livers. Young and aged mice (n = 6 mice per group) were subjected to liver partial warm ischemia for 1.5 hr followed by 6 hr of reperfusion. HE and TUNEL-stained tissue sections of livers (a). Average levels of serum ALT and AST in mice (b). Suzuki’s scores based on liver H&E-stained sections and TUNEL-positive percentages evaluated by ImageJ software (c). Macrophage inflammation-related gene expression (CD86, TNF-α, IFN-γ, CD206, IL-10, ARG-1) was measured by qRT–PCR (d). CD86 or CD206 was detected by IHC in liver tissue sections post I/R (e), and percentages were evaluated by ImageJ software (f). Data are presented as the mean ± SEM and performed by one-way analysis, P values <0.05 (two-tailed) were considered statistically significant.
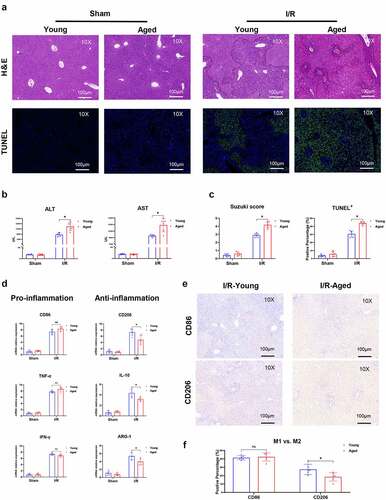
Figure 3. Aging suppressed macrophage TRIB1 in hepatic I/R. Young or aged mice (n = 6 mice per group) were subjected to liver partial warm ischemia for 1.5 hr followed by 6 hr of reperfusion. TRIB1 in F4/80+ macrophages in liver tissue sections detected by IHC (a), and percentages were evaluated by ImageJ software (b). Western blotting analysis of TRIB1 protein extracted from I/R-stressed liver tissues (c) or H/R-stressed BMDMs (d), and relative intensity levels were analyzed by ImageJ software (e). TRIB1 detected by IF in BMDMs (f), and relative intensity levels were analyzed by ImageJ software (g). Data are presented as the mean ± SEM and performed by one-way analysis, P values <0.05 (two-tailed) were considered statistically significant.
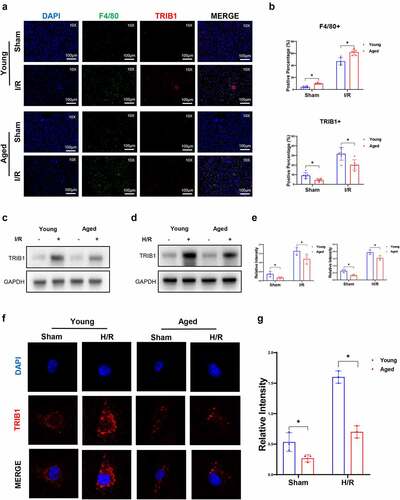
Figure 4. Lentiviral transfection of BMDMs in vitro and depletion of macrophages in vivo. Western blotting (A&B) and IF (c) analysis of TRIB1 post-LV transduction in BMDMs. Apoptosis (d) and polarization (e) detected by flow cytometry. IHC detection of F4/80+ macrophage (f) and TRIB1 expression in BMDMs (g).
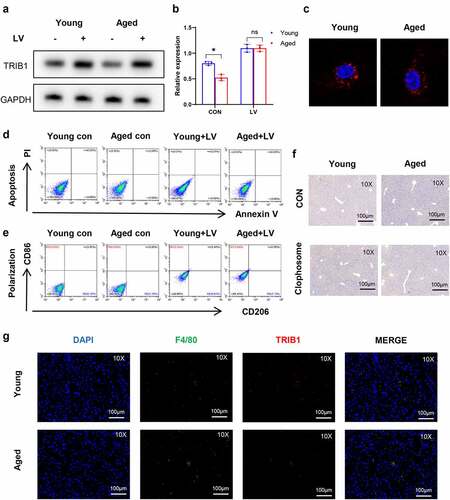
Figure 5. Restoration of TRIB1 induced macrophage anti-inflammatory M2 polarization to alleviate hepatic I/R injury. Lentiviral infection of macrophages was performed to overexpress TRIB1 following the manufacturer’s protocol. LV-infected BMDMs were infused back into the mice via the tail vein at 1 hr pre-operation. HE (a) and TUNEL-stained (b) tissue sections of livers. Average levels of serum ALT and AST in mice (c). Suzuki’s scores based on liver H&E-stained sections and TUNEL-positive percentages evaluated by ImageJ software (d). The macrophage polarization phenotype (CD86, CD206) (e) and inflammation-related gene expression (TNF-α, IFN-γ, IL-10, ARG-1) (f) were measured by qRT–PCR. CD206 detected by IHC in liver tissue sections post I/R (g). Data are presented as the mean ± SEM and performed by one-way analysis, P values <0.05 (two-tailed) were considered statistically significant.
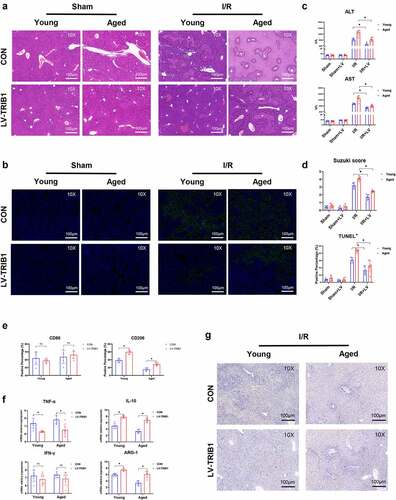
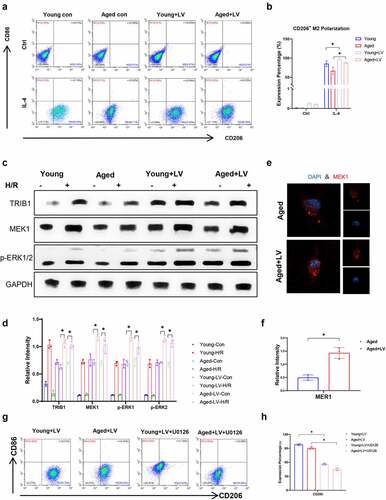
Figure 6. TRIB1 assisted macrophage M2 polarization and anti-inflammation by MEK1-ERK1/2 signaling. Lentiviral infection of macrophages was performed to overexpress TRIB1 following the manufacturer’s protocol. CD206+ M2 polarization detected by FC (A&B). Western blotting (C&D) and IF (E&F) analysis of MEK1-ERK1/2 signaling. FC analysis of CD206 in BMDMs undergoing US0126-inhibited MEK1 (G&H). Data are presented as the mean ± SEM and performed by one-way analysis, P values <0.05 (two-tailed) were considered statistically significant.