
Figures & data
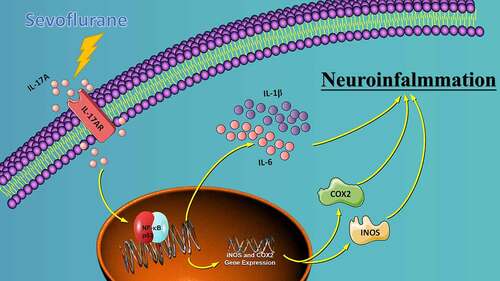
Figure 1. Experimental flow chart. Mice received anesthesia on postnatal days 6, 7 and 8 (P6–8) with 3% sevoflurane supplemented with 60% oxygen for 2 h daily. RNA-seq and RT-PCR were performed at P30, the Morris water maze test was conducted on P30 to P36. At P36, after the Morris water maze test, Nissl staining, HE staining, ELISA, western blot and immunofluorescence assay were performed.
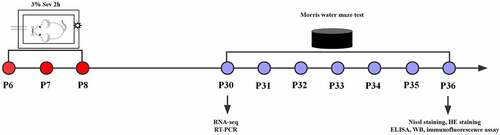
Figure 2. DEG identification and GO analysis of DEGs. (a) Representative heat map of differentially expressed genes in WT and WT + sevoflurane group. (b) Representative heat map of differentially expressed genes in IL-17A−/− and IL-17A−/− + Sev group. (c) Differential gene volcano map in WT and WT + sevoflurane group. (d) Differential gene volcano map in IL-17A−/− and IL-17A−/− + Sev group. (e-f) GO enrichment analysis upregulated pathways in WT and WT + sevoflurane group. (g-h) GO enrichment analysis downregulated pathways in WT and WT + sevoflurane group.
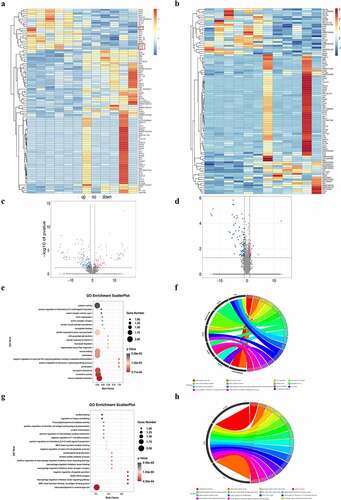
Table 1. Top 10 up-regulated and down-regulated DEGs.
Figure 3. KEGG pathway analysis of DEGs, PPI network construction and hub gene identification (a) KEGG pathway enrichment scatter diagram in WT and WT + sevoflurane group. (b) KEGG pathway enrichment scatter diagram in IL-17A−/− and IL-17A−/− + Sev group. (c) The protein–protein interaction network of DEGs in WT and WT + sevoflurane group. (d)Ten hub genes with the highest degree in WT and WT + sevoflurane group(Red square indicates a higher degree, and yellow square indicates a lower degree). (e) GSEA gene enrichment analysis diagram. (f) Differential expression of IL-17 was confirmed by RT-PCR. Data are expressed as mean ± SD. Compared with WT group, *P < 0.05.
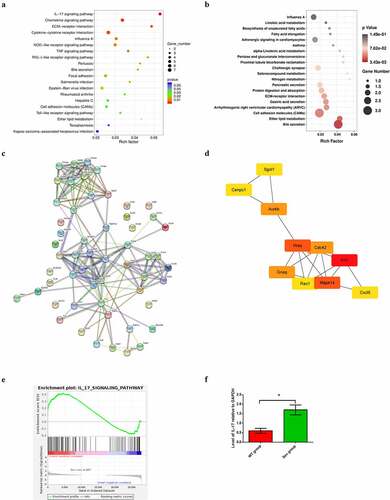
Table 2. Degree of top 10 hub genes.
Figure 4. IL-17A deletion ameliorates learning and memory impairment induced by repeated sevoflurane exposure in neonatal mice. (a) Swimming trajectory in spatial exploration experiment. (b) Average escape latency. (c) Times of crossings of the platform area. (d) Average swimming speed in the MWM test. Data are expressed as mean ± SD (n = 30 for each group). Compared with the WT group, *P < 0.05; compared with the Sev group, #P < 0.05.
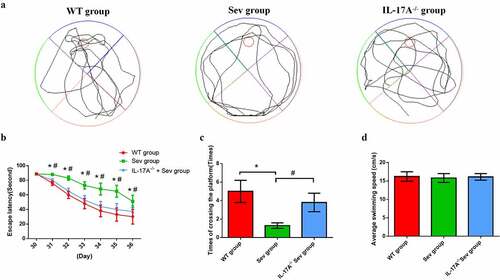
Figure 5. IL-17A deletion ameliorates neuronal injury after repeated sevoflurane exposure in neonatal mice. (a) Representative photomicrographs of Nissl staining in the hippocampal CA1 region; scale bar = 10 μm. (b) Quantification of the number of Nissl bodies using Nissl staining in the hippocampal CA1 region. (c) Representative images of histopathological changes in the hippocampal CA1 of neonatal mice. Data are expressed as mean ± SD (n = 5 for each group). Compared with the WT group, *P < 0.05; compared with the Sev group, #P < 0.05.
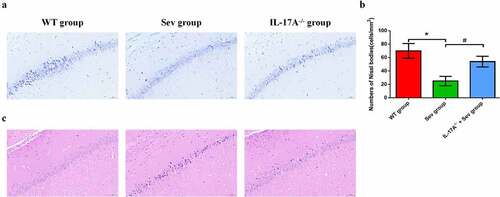
Figure 6. IL-17A deletion diminishes the increase in inflammatory factor levels induced by repeated exposure to sevoflurane in neonatal mice. The levels of hippocampal IL-6 (a) and IL-1β (b). Data are presented as mean ± SD (n = 5 for each group). Compared with the WT group, *P < 0.05; compared with the Sev group, #P < 0.05.
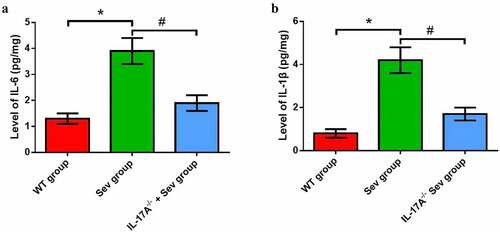
Figure 7. IL-17A deletion ameliorates activation of repeated sevoflurane exposure-induced NF-κB signaling pathway in neonatal mice. (a) Representative western blot of IL-17A, NF-κB p65, iNOS and COX-2. (b) Representative histogram of the relative expression of IL-17A, NF-κB p65, iNOS and COX-2. Data are expressed as mean ± SD (n = 10 for each group). Compared with the WT group, *P < 0.05; compared with the Sev group, #P < 0.05.
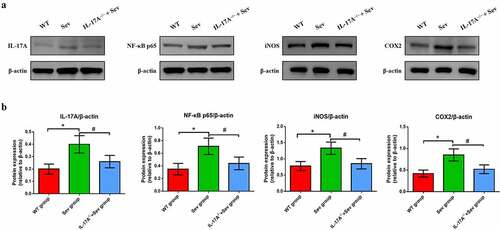
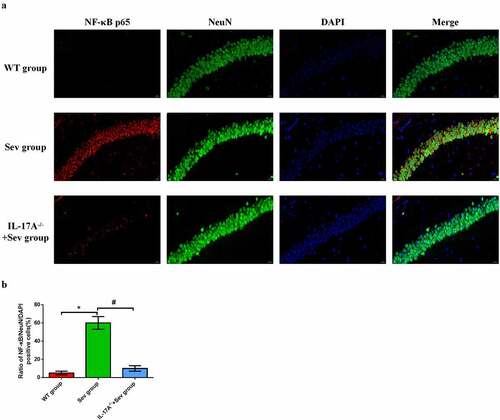
Figure 8. IL-17A deletion reduces the upregulation of NF-κB p65 in repeated sevoflurane exposure-induced hippocampal neuronal cells in neonatal mice. (a) Representative photomicrographs of NF-κB p65/NeuN/DAPI staining (NF-κB p65: red; NeuN: green; DAPI: blue); scale bar = 10 μm. (b) Percentages of NF-κB p65/NeuN/DAPI positive cells. Data are expressed as mean ± SD. Compared with the WT group, *P < 0.05; compared with the Sev group, #P < 0.05.
Supplemental Material
Download Zip (2.7 MB)Data availability statement
The datasets generated and/or analysed during the current study are available from the corresponding author on reasonable request.