Figures & data
Figure 1. Screening, identification and expression analysis for circ_0070659 in lung cancer tissues and cells. (a) Volcano map of differentially expressed circRNAs from GEO database under accession number GSE158695. (b–f) The expression of 5 circRNAs in 10 pairs of NSCLC tumor tissues and paracancerous normal tissues was analyzed by RT-qPCR. (g) RT-qPCR was performed to examine the circ_0070659 expression in lung cancer samples and adjacent normal tissues. (h) ROC curves were conducted to determine the diagnostic role of circ_0070659 for lung cancer. (i) RT-qPCR was used to assess the circ_0070659 expression levels in different NSCLC cell lines and normal cell line. *P < 0.05 and ***P < 0.001 vs. 16HBE group. **P < 0.01 vs. 16HBE group and normal group.
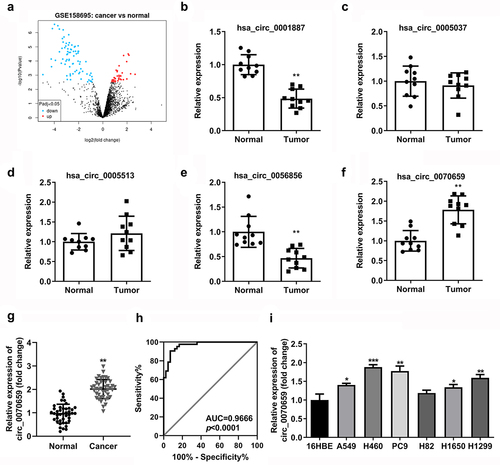
Figure 2. Characterization of circ_0070659. (a) The circ_0070659 and linear mRNA expression levels in H460 and PC9 cells after RNase R treatment were detected by RT-qPCR. (b) The RNA abundance of circ_0070659 and linear mRNA were analyzed by RT-qPCR at five crucial time points after actinomyces D treatment. **P < 0.01 vs. circular group. All data are expressed as mean ± SD of at least three independent experiments.
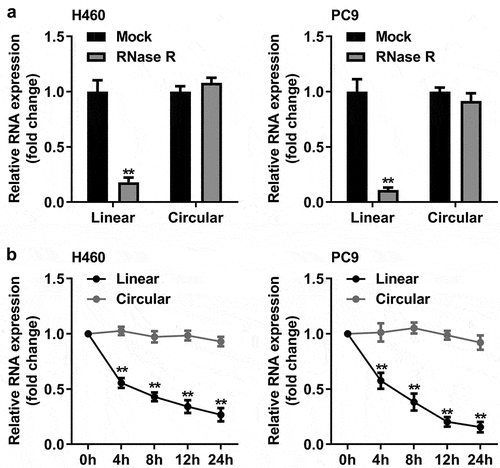
Figure 3. Knockdown of circ_0070659 contributed to the inhibition of lung cancer cells proliferation, migration and invasion. (a) RT-qPCR was used to detect the circ_0070659 levels in H460 and PC9 cells after transfection of sh-nc, sh-circ_0070659 1# or sh-circ_0070659 2#. (b) CCK-8 and (c) colony formation assays were designed to analyze the proliferative capacity and colony-forming ability of H460 and PC9 cells after circ_0070659 knockdown. Transwell assay was performed to determine the migration (d) and invasion (e) abilities of H460 and PC9 cells after knockdown of circ_0070659. Cell migration and invasion abilities were significantly down-regulated in the sh-circ_0070659 group compared to the sh-nc group. **P < 0.01 vs. sh-nc group.
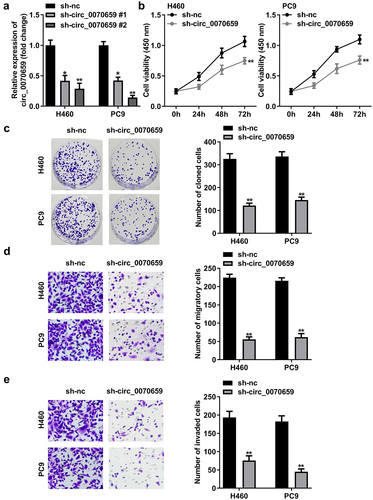
Figure 4. Circ_0070659 acted as a molecular sponge of miR-377. (a) After knockdown of circ_0070659, the levels of eight target miRNAs in NSCLC were determined by RT-qPCR. (b) Binding sites and mutation sites between circ_0070659 and miR-377. (c) Dual luciferase reporter assays were utilized to examine whether circ_0070659 could bind to miR-377. Relative luciferase activity was assayed in H460 or PC9 cells transfected with WT-circ_0070659 or MUT-circ_0070659, miR-377 mimics or miR-377 mimics. (d) RNA pull-down assay was performed with biotin-miR-377, biotin-nc or 10% input to verify the interaction of circ_0070659 with miR-377. (e) Expression of miR-377 was assayed in H460 and PC9 cells transfected with sh-nc, sh-circ_0070659. (e) Expression of miR-377 in NSCLC tumor tissues or adjacent normal tissues was detected by RT-qPCR. (f) MiR-377 mRNA levels in H460 and PC9 cells were lower than those in 16HBE cells. **P < 0.01 vs. nc mimic, biotin-nc, sh-nc, normal, and 16HBE groups. nc, negative control.
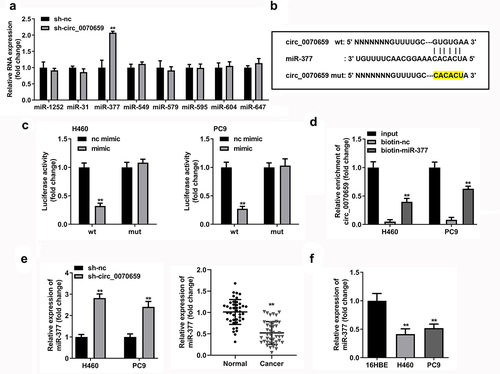
Figure 5. MiR-377 inhibition attenuated sh-circ_0070659-induced cell death in H460 and PC9 cells. (a) RT-qPCR was utilized to examine transfection efficiency of miR-377 inhibitor and miR-377 mimic. (b, c) Cell viability (b), colony formation (c) was detected in H460 and PC9 cells transfected with sh-circ_0070659+ nc inhibitor and sh-circ_0070659+ miR-377 inhibitor. Transwell assays were performed to assess the migration (d) and invasion (e) abilities of H460 and PC9 cells transfected with sh-circ_0070659 + nc inhibitor, sh-circ_0070659 + miR-377 inhibitor. ##P < 0.05 vs. nc mimic, sh-circ_0070659 + nc inhibitor groups; **P < 0.01 vs. control, nc inhibitor groups.
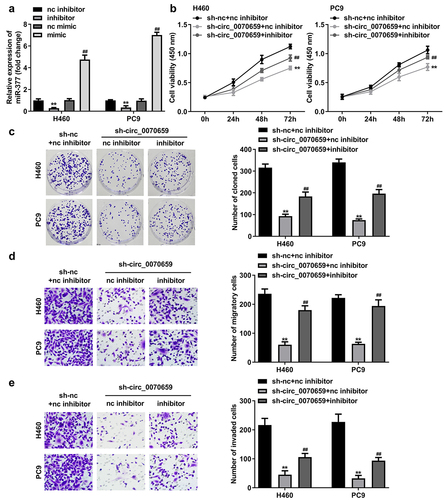
Figure 6. Bioinformatic prediction and validation of miR-377 potential targeting mRNA in NSCLC cells. (a) The Venn diagram showed target genes regulated by miR-377 that were predicted by TargetScan, starBase and miRDB database. (b) After treatment with miR-377 inhibitor, the levels of 10 target mRNA molecules were detected using RT-qPCR. (c) The combinative sites between miR-377 and RAB3C 3′UTR were exhibited. (d) Dual luciferase reporter assay verified the relationship between miR-377 and RAB3C in H460 and PC9 cells. (e) RNA pull-down assay confirmed the interaction between miR-377 and RAB3C. (f, g) Expression levels of RAB3C mRNA and protein were detected in H460 and PC9 cells transfected with sh-nc, sh-circ_0070659, sh-circ_0070659 + nc inhibitor and sh-circ_0070659 + miR-377 inhibitor. (h) The RAB3C levels in tumor tissues and adjacent paired normal tissues were analyzed using RT-qPCR. (i) Expression levels of RAB3C were detected in 16HBE, H460 and PC9 cells. (j) Pearson’s coefficient correlation between circ_0070659 and RAB3C (r = 0.7295, P < 0.0001). ##P < 0.05 vs. sh-circ_0070659+ nc inhibitor group; **P < 0.01 vs. nc inhibitor, nc mimic, biotin-nc, sh-nc, normal and 16 HBE groups.
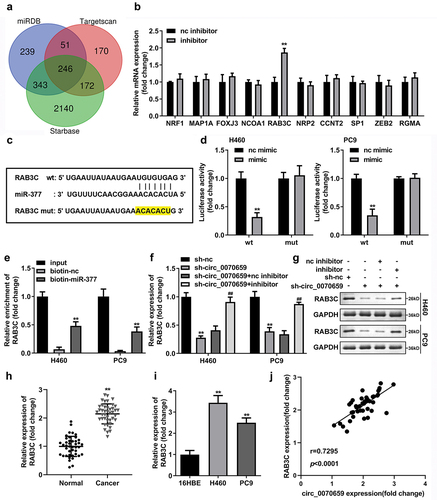
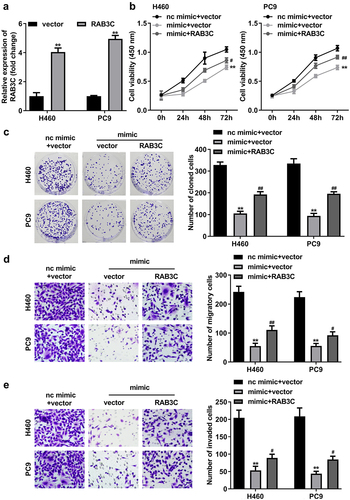
Figure 7. MiR-377 worked through RAB3C in NSCLC cells. (a) RT-qPCR assays were performed to detect RAB3C expression in H460 or PC9 cells transfected with RAB3C overexpression vector or pcDNA3.1 vector (vector). Cell viability and colony formation rates in H460 and PC9 cells transfected with nc mimic+vector (control), miR-377 mimic (mimic) + vector, miR-377 mimic + RAB3C were detected by CCK-8 (b), colony formation (c) assays. Transwell assays examined the migration (d) and invasion (e) abilities of H460 and PC9 cells transfected with nc mimic+vector (control), miR-377 mimic+vector, miR-377 mimic+RAB3C. #P < 0.05, ##P < 0.01 vs. miR-377 mimic+vector group; **P < 0.01 vs. control group.