Figures & data
Figure 1. Geniposide alleviates weight loss and colonic tissue damage in UC mice. UC model mice were treated with different doses of geniposide (10 mg/kg or 20 mg/kg) for 4 weeks. (a) The body weight of mice in each group was recorded weekly. (b) HE staining was used to detect the histological changes in colon tissues in each group. (c) related to B. The pathological score of colon tissues of mice in each group was calculated according to HE staining. (d) Representative western blot showing the protein expression levels of Claudin-1 and Occludin in colon tissues of each group of mice. (e) related to D. Relative quantitative analysis of the protein expression levels of Claudin-1 and Occludin in colon tissues of each group. A-C, n = 6. D-E, n = 3. *p < 0.05, **p < 0.01.
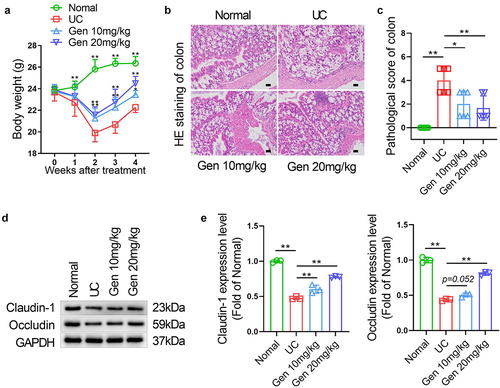
Figure 2. Geniposide improves immune function and decreased inflammation in UC mice. UC model mice were treated with different doses of geniposide (10 mg/kg or 20 mg/kg) for 4 weeks. (a) Representative images of immunohistochemistry of IL-1β, IL-10, and TNF-α in colon tissues of each group of mice. (b) related to A. The mean optical density analysis of IL-1β, IL-10 and TNF-α expression in colon tissues of mice in each group. (c) Serum IL-1β, IL-10, TNF-α levels were detected by ELISA. (d) The IL-1β, IL-10 and TNF-α mRNA expression in colon tissues of mice in each group. (e) Representative images of immunohistofluorescence of FOX3 in colon tissues of each group of mice. (f) related to E. The mean optical density analysis of FOX3 expression in colon tissues of mice in each group. (g) Representative flow cytometry images showing the percentage of CD4-positive and FOX3-positive cells in the spleen cells of each group of mice. (h) related to G. The percentage of CD4 and FOX3 double-positive cells in mouse spleen cells was calculated. A-B and D-H n = 3. C, n = 6. *p < 0.05, **p < 0.01.
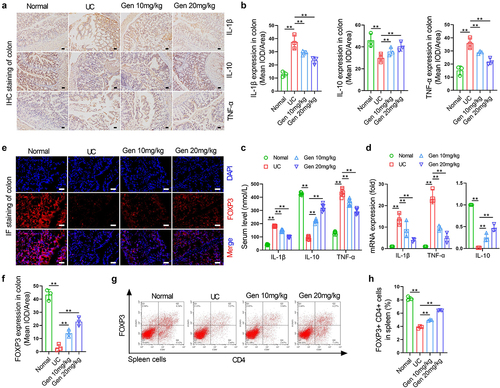
Figure 3. Geniposide reduces LPS-induced inflammation and tight joint damage in colon cells by promoting Treg differentiation of spleen cells. Spleen cells were isolated from normal mice, and Treg differentiation was induced by 100 U/mL IL-2 and 10 ng/mL TGF-β. The spleen cells were placed in the upper compartment of the coculture chamber, and garinoside (25 μM) was added to treat the differentiation-induced cells. Caco-2 cells were placed in the lower chamber of the coculture chamber, and LPS (10 nM) was used to induce Caco-2 cell damage. (a) Schematic diagram of coculture spleen cells and Caco-2 cells indicating the experimental grouping and cell intervention. (b) Upper compartment spleen cells were taken from the coculture system. Representative flow cytometry images show the percentage of CD4-positive and FOX3-positive cells in spleen cells of each group. (c) related to B. The percentage of CD4 and FOX3 double-positive cells in mouse spleen cells was calculated. (d) In the coculture system, the culture medium in the lower chamber was taken, and the level of IL-1β was detected by ELISA. (e) In the coculture system, the culture medium in the lower chamber was taken, and the level of CCL-2 was detected by ELISA. (f) In the coculture system, the culture medium in the lower chamber was taken, and the level of TNF-α was detected by ELISA. (g) Representative images of immunohistofluorescence of Claudin-1 in cacO-2 cells from each group. (h) related to G. The mean optical density analysis of Claudin-1 in the cacO-2 cells of each group. (i) Representative images of immunohistofluorescence of Occludin in cacO-2 cells of each group. (j) related to I. The mean optical density analysis of Occludin in cacO-2 cells of each group. B-C and G-J, n = 3. D-F, n = 6. *p < 0.05, **p < 0.01.
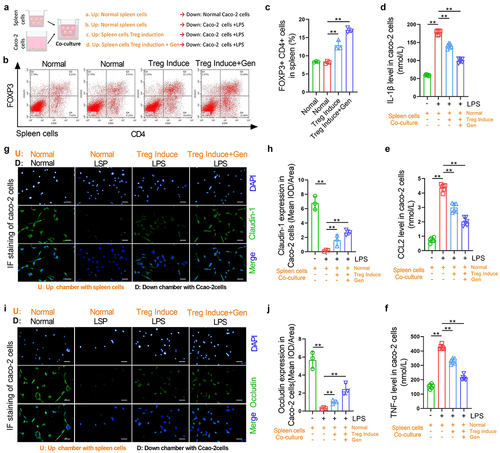
Figure 4. Immunosuppressive agents cancel the alleviating effect of garinoside on weight loss and colonic tissue damage in UC mice. UC model mice were treated with geniposide (20 mg/kg) alone or in combination with the immunosuppressive agent BD750 (20 μg/kg) for 4 weeks. UC model mice were treated with different doses of geniposide (10 mg/kg or 20 mg/kg) for 4 weeks. (a) The body weight of mice in each group was recorded weekly. (b) HE staining was used to detect the histological changes in colon tissues in each group. (c) related to B. The pathological score of colon tissues of mice in each group was calculated according to HE staining. (d) Representative western blot showing the protein expression levels of Claudin-1 and Occludin in colon tissues of each group of mice. (e) related to D. Relative quantitative analysis of the protein expression levels of Claudin-1 and Occludin in colon tissues of each group. A-C, n = 6. D-E, n = 3. *p < 0.05, **p < 0.01.
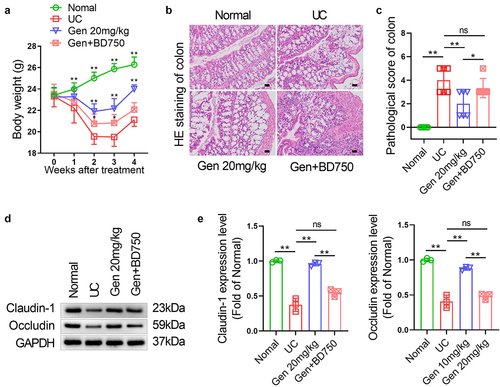
Figure 5. Immunosuppressive agents cancel the promotion effect on splenic cell Treg differentiation and the inhibitory effect of geniposide on inflammation in UC mice. UC model mice were treated with geniposide (20 mg/kg) alone or in combination with the immunosuppressive agent BD750 (20 μg/kg) for 4 weeks. (a) Representative images of immunohistochemistry of IL-1β, IL-10, and TNF-α in colon tissues of each group of mice. (b) related to A. The mean optical density analysis of IL-1β, IL-10 and TNF-α expression in colon tissues of mice in each group. (C) Serum IL-1β levels were detected by ELISA. (d) Serum IL-10 levels were detected by ELISA. (e) Serum TNF-α levels were detected by ELISA. (f) Representative images of immunohistofluorescence of FOX3 in colon tissues of each group of mice. (g) related to F. The mean optical density analysis of FOX3 expression in colon tissues of mice in each group. (h) Representative flow cytometry images showing the percentage of CD4-positive and FOX3-positive cells in the spleen cells of each group of mice. (i) related to F. The percentage of CD4 and FOX3 double-positive cells in mouse spleen cells was calculated. A-B and F-I, n = 3. C-E, n = 6. *p < 0.05, **p < 0.01.
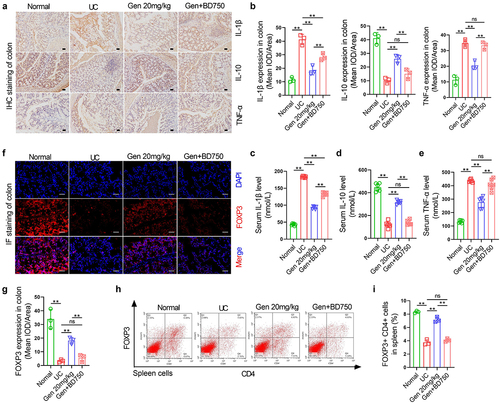
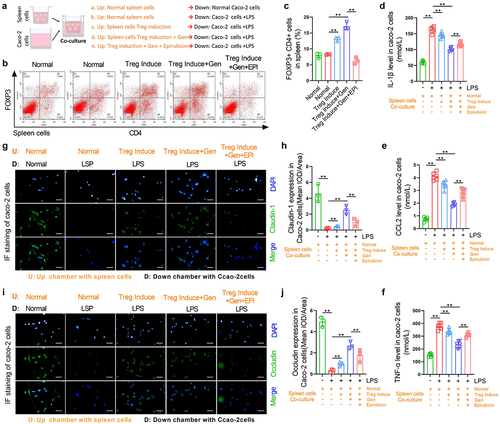
Figure 6. The relief of inflammation and tight joint damage by geniposide in colonic cells requires its induction of Treg differentiation in spleen cells. Spleen cells were isolated from normal mice, and Treg differentiation was induced by 100 U/mL IL-2 and 10 ng/mL TGF-β. The spleen cells were placed in the upper compartment of the coculture chamber, and garinoside (25 μM) was added to treat the differentiation-induced cells. Epirubicin (20 nM) was combined with geniposide (25 μM) in one group. Caco-2 cells were placed in the lower chamber of the coculture chamber, and LPS (10 nM) was used to induce Caco-2 cell damage. (a) Schematic diagram of coculture spleen cells and Caco-2 cells indicating the experimental grouping and cell intervention. (b) Upper compartment spleen cells were taken from the coculture system. Representative flow cytometry images show the percentage of CD4-positive and FOX3-positive cells in spleen cells of each group. (c) related to B. The percentage of CD4 and FOX3 double-positive cells in mouse spleen cells was calculated. (d) In the coculture system, the culture medium in the lower chamber was taken, and the level of IL-1β was detected by ELISA. (e) In the coculture system, the culture medium in the lower chamber was taken, and the level of CCL-2 was detected by ELISA. (f) In the coculture system, the culture medium in the lower chamber was taken, and the level of TNF-α was detected by ELISA. (g) Representative images of immunohistofluorescence of Claudin-1 in cacO-2 cells from each group. (h) related to G. The mean optical density analysis of Claudin-1 in the cacO-2 cells of each group. (i) Representative images of immunohistofluorescence of Occludin in cacO-2 cells of each group. (j) related to I. The mean optical density analysis of Occludin in cacO-2 cells of each group. B-C and G-J, n = 3. D-F, n = 6. *p < 0.05, **p < 0.01.