Figures & data
Figure 1. Flowchart of data filtration processing and excluding publications.
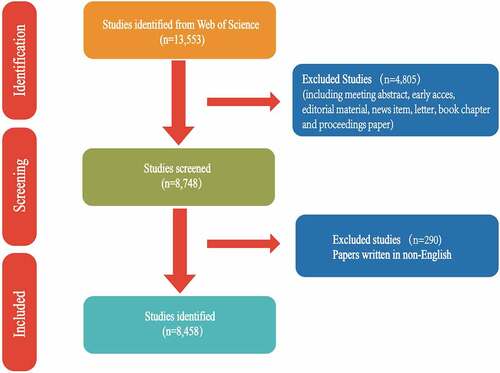
Figure 2. Annual quantity and the types of literature published on pulmonary arterial hypertension (PAH). (a) the types of and (b) annual numberpublished publications in PAH research from 2011 to 2020.
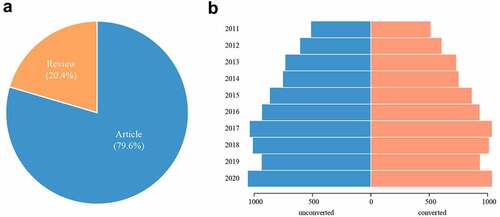
Table 1. Citation count of the 10 most influential publications.
Figure 3. The distribution of countries or regions publishing PAH research. (a) Distribution of PAH literature in a world map, (b) bubble map of the number of publications related to PAH derived from different countries or regions from 2011 to 2020, (c) rose map of the number of publications related to PAH in analyzing the top 100 cited papers produced by different countries or regions from 2011 to 2020.
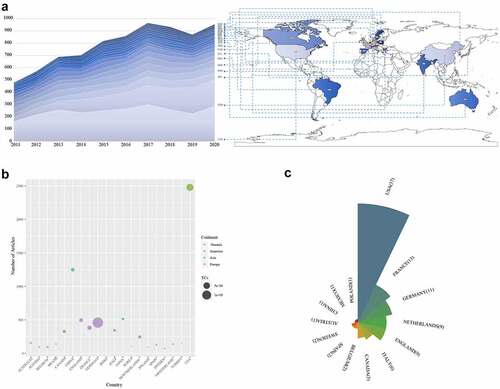
Figure 4. Collaboration network of countries or regions. (a) The cooperation between countries or regions that published articles related to PAH from 2011 to 2020. (b) The cooperation relationships of countries or regions that published the top 100 cited articles.
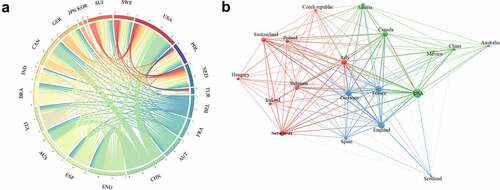
Table 2. Top 10 institutions that published the highest number of articles from 2011 to 2020.
Table 3. Top 10 institutions that published the highest number of articles when analyzing the 100 most cited articles from 2011 to 2020.
Figure 5. Collaboration network of institutions. The cooperation relationships of institutes that published articles related to PAHfrom 2011 to 2020. Different colors represent different clusters.
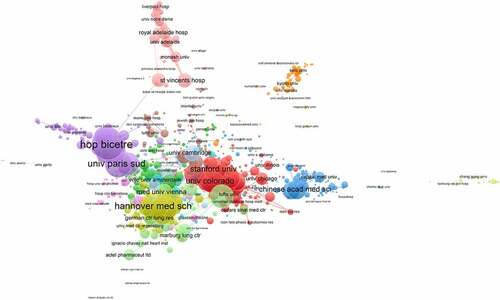
Table 4. Top 10 prolific authors in the area of pulmonary arterial hypertension from 2011 to 2020.
Table 5. Top 10 prolific authors in the area of pulmonary arterial hypertension in analyzing 100 most cited papers from 2011 to 2020.
Figure 6. Collaboration network of authors. The cooperation relationships of authors that published articles related to PAH from2011 to 2020. Different colors represent different clusters.
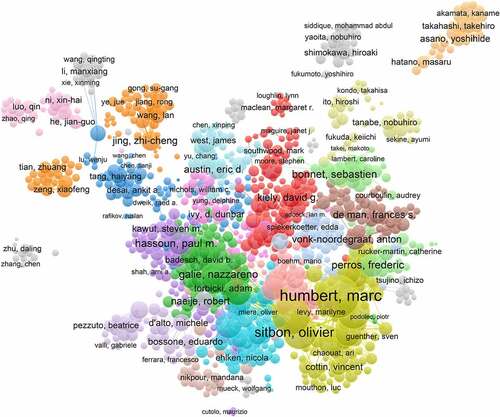
Table 6. Top 10 cited journals from 2011 to 2020.
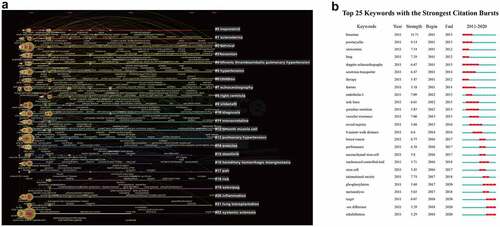
Figure 7. Timeline view and keywords burst. (a) Timeline view of keywords related to pulmonary arterial hypertension. (b) Keywords burst.