
Figures & data
Figure 1. Flow diagram of study selection.
Table 1. Baseline characteristics of eligible clinical trials.
Figure 2. Risk of bias of included studies.
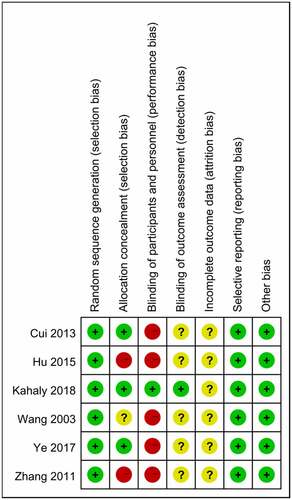
Figure 3. Funnel plot for the response of MMF (with or without GC) versus GC. MMF: mycophenolate mofetil; GC: glucocorticoid.
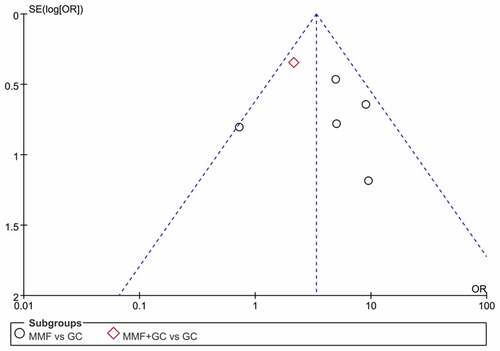
Figure 4. Sensitivity analysis for the response of MMF (with or without GC) versus GC. MMF: mycophenolate mofetil; GC: glucocorticoid.
Figure 5. Forest plot for the response of MMF (with or without GC) versus GC. MMF: mycophenolate mofetil; GC: glucocorticoid.
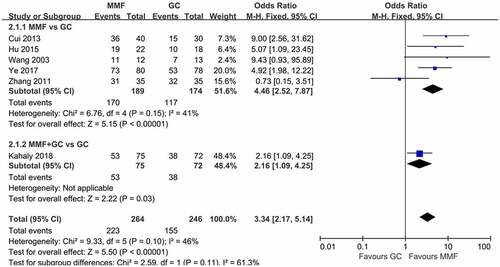
Figure 6. Forest plot for CAS change of MMF (with or without GC) versus GC. CAS: clinical activity score; MMF: mycophenolate mofetil; GC: glucocorticoid.
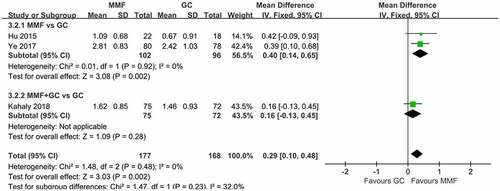
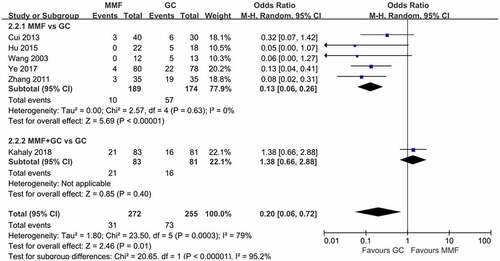
Figure 7. Forest plot for the incidence of AE of MMF (with or without GC) versus GC. AE: adverse event; MMF: mycophenolate mofetil; GC: glucocorticoid.
Data availability statement
All data are provided in this article, and data processing methods can be obtained from corresponding author upon reasonable request.