Figures & data
Table 1. Characteristics of SUT genes in Solanaceae species.
Figure 1. The phylogenetic analysis of SUT proteins from C. annuum, S. lycopersicum, S.melongena, S. tuberosum. Fourteen SUT proteins were used to construct the NJ tree with 1000 bootstraps based on the protein sequences. The SUT proteins were grouped into 3 groups.
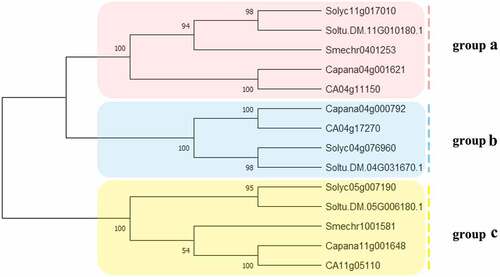
Figure 2. Phylogenetic relationships among SUT genes in 17 plant species. The species’ abbreviations were as follows: C. annuum (Ca), A. thaliana. (At), S. lycopersicum (Sl), O. sativa (Os), V. vinifera (Vv), S. melongena (Sm), S. bicolor (Sb), C. lanatus (Cl), C. moschata (Cm), B. vulgaris (Bv), C. sativus (Cs), P. vulgaris (Pv), T. cacao (Tc), Z. mays (Zm), S. tuberosum (St), D. carota (Dc) and L.siceraria (Ls). The phylogenetic tree was constructed using the neighbor-joining (NJ) method and with 1000 bootstrap replications. The numbers at the nodes represented bootstrap percentage values. 72 SUT proteins were divided into 3 subgroups. Three subgroups were marked with different background colors.
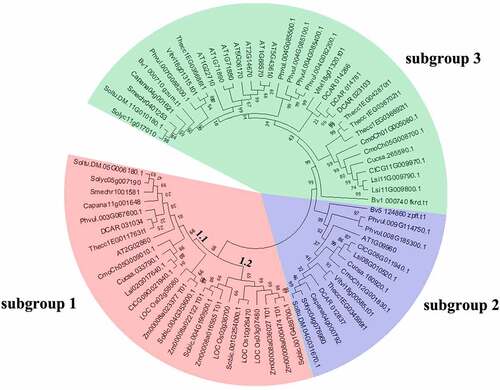
Figure 3. Distribution of CaSUT genes and Solanaceae SUTs gene on the chromosomes. The SUTs positions were shown as red lines. Chromosome numbers are shown at the top of each bar.
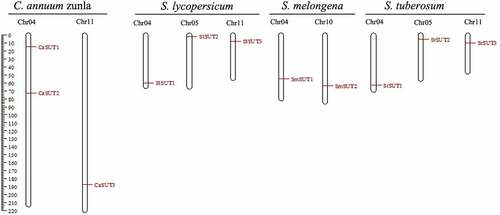
Figure 4. Genes structural organization of 14 SUTs. a) C. annuum Zunla and C. annuum cv CM334; b) S. lycopersicum, S. melongena, and S. tuberosum. Exons and introns were represented by yellow boxes and black lines, respectively. The. upstream/downstream were represented by blue boxes. The sizes of exons and introns are proportional to their sequence lengths. 0 = intron phase 0; 1 = intron phase 1; 2 = intron phase 2.
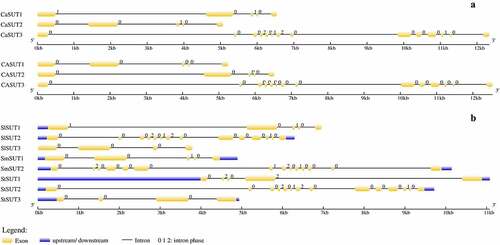
Figure 5. Distributions of conserved motifs in SUT proteins in Solanaceae species. Motifs of the SUT proteins identified by the online tool MEME. Different motifs are indicated by different colors and numbered 1–20. The same number in different proteins referred to the same motif.
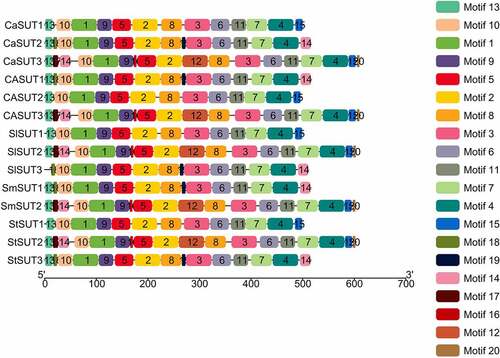
Figure 6. Promoters of SUT genes of pepper and their cis-elements analysis. The colored boxes represented different responsive cis-elements.
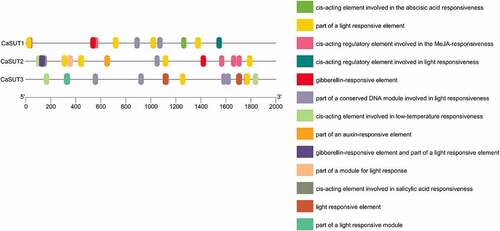
Figure 7. Heat map of the expression pattern of SUT genes in different tissues of pepper. L1-L9 indicated the expression of CaSUTs in leaves at 2, 5, 10, 15, 20, 25,30, 40 and 50 days after emergence; F1-F9 represented flower buds of different stages; P10: petals; O10: ovary; STA10: stamens; G1-G11 indicated the expression of CaSUTs in fruits at 3, 7, 10, 15, 20, 25, 30, 35, 40, 45 and 50 days after flowering, respectively; ST1 and ST2 represented seeds and placenta in fruits 10 and 15 days after flowering, respectively; S3-S11 indicated the expression of CaSUTs in leaves at 20, 25, 30, 35, 40, 45, 50, 55 and 60 days after flowering. Expression levels of the CaSUT genes were shown as the Log2 transformed FPKM values obtained from the RNA-Seq data. Heat maps were presented in blue/white/red colors that represent high/medium/low expression, respectively.
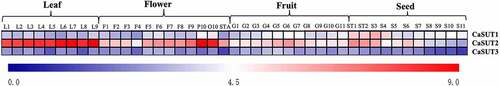
Figure 8. Heatmap showing the expression patterns of the CaSUT genes under different salt, cold and high temperature stress. CL0 indicated the expression of CaSUT in pepper leaves in the control group without any treatment; CR0 denotes the expression of CaSUT in pepper roots in the control group without any treatment; numbers 1–3 represented the expression of CaSUTs in leaves/roots of seeding at 0.5, 1, 3, 6, 12 and 24 hours after salt, cold and high temperature stress, respectively. HL/HR referred to the expression of CaSUT genes in leaves/roots under high temperature treatment; FL/FR indicated the expression of CaSUT genes in leaves/roots under cold temperature treatment; NL/NR indicated the expression of CaSUT genes in leaves/roots under salt stress. Heat maps were presented in blue/white/red colors that represent high/medium/low expression, respectively.
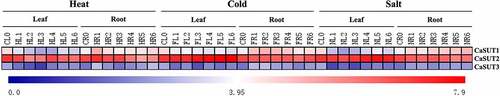
Figure 9. Heatmap showing the expression patterns of the CaSUT genes under methyl jasmonic acid (MeJA) and abscisic acid (ABA) treatment. CL0 indicated the expression of CaSUT in pepper leaves in the control group without any treatment; CR0 denoted the expression of CaSUT in pepper roots in the control group without any treatment; numbers 1–3 represented the expression of CaSUTs in leaves/roots of seeding at 0.5, 1, 3, 6, 12 and 24 hours after salt, cold and high temperature stress, respectively. JL/JR ped the expression of CaSUT genes in leaves/roots under MeJA treatment; AL/AR denoted the expression of CaSUT genes in leaves/roots under ABA treatment. Heat maps were presented in blue/white/red colors that represent high/medium/low expression, respectively.
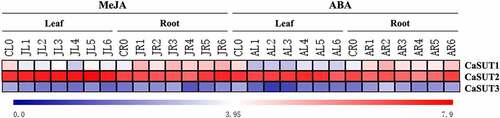
Table 2. The primers used in quantitative real-time PCR (qRT-PCR) analysis in this study.
Figure 10. Expression patterns of CaSUT genes under abiotic stresses at different time points. CK referred to the untreated pepper seedlings that were only mock-treated with nutrient solution. The relative expression levels referred to the expression levels of the set time points after stresses were compared with those of untreated pepper seedlings. (a) cold stress, (b) heat stress, (c) salt stress.