Figures & data
Table 1. The significantly differential metabolite between four varieties of Zanthoxylum bungeanum pericarp.
Figure 1. The principal component analysis (PCA) (Figure 1a), heat map (Figure 1b) and correlation (Figure 1c) among four varieties of Zanthoxylum bungeanum pericarp.
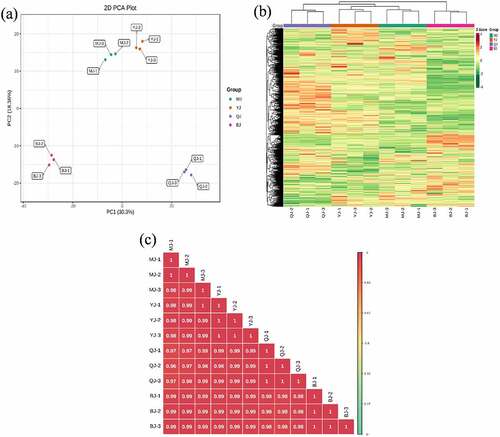
Figure 2. The orthogonal partial least square discriminant analysis (OPLS-DA) score between treatment MJ and BJ (Figure 2a), MJ and QJ (Figure 2b), MJ and YJ (Figure 2c), QJ and BJ (Figure 2d), YJ and BJ (Figure 2e), YJ and QJ (Figure 2f).
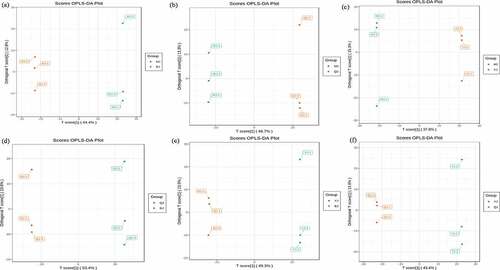
Figure 3. The orthogonal partial least square discriminant analysis model validation diagram between treatment MJ and BJ (Figure 3a), MJ and QJ (Figure 3b), MJ and YJ (Figure 3c), QJ and BJ (Figure 3d), YJ and BJ (Figure 3e), YJ and QJ (Figure 3f).
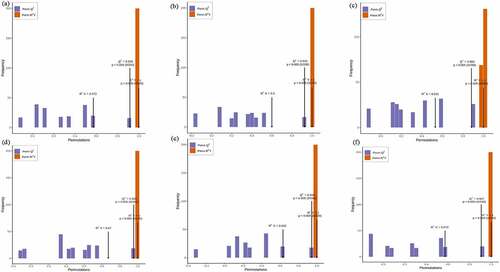
Figure 4. The volcano plots based differential metabolite contents between treatment MJ and BJ (Figure 4a), MJ and QJ (Figure 4b), MJ and YJ (Figure 4c), QJ and BJ (Figure 4d), YJ and BJ (Figure 4e), YJ and QJ (Figure 4f).
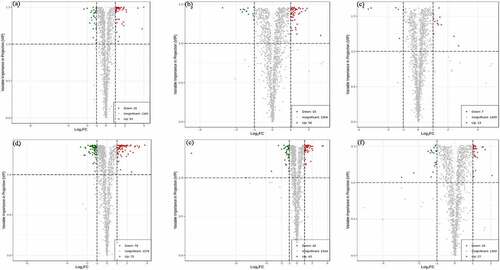
Figure 5. The difference multiples histogram based top ten differential metabolite contents in treatment MJ and BJ (Figure 5a), MJ and QJ (Figure 5b), MJ and YJ (Figure 5c), QJ and BJ (Figure 5d), YJ and BJ (Figure 5e), YJ and QJ (Figure 5f).
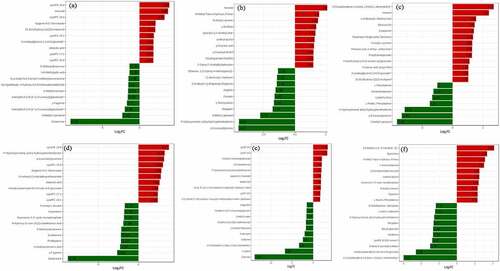
Figure 6. The clustering heatmap based on differential metabolite contents between treatment MJ and BJ (Figure 6a), MJ and QJ (Figure 6b), MJ and YJ (Figure 6c), QJ and BJ (Figure 6d), YJ and BJ (Figure 6e), YJ and QJ (Figure 6f).
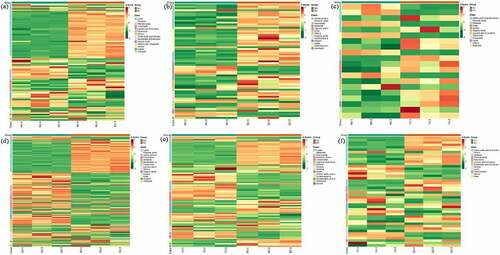
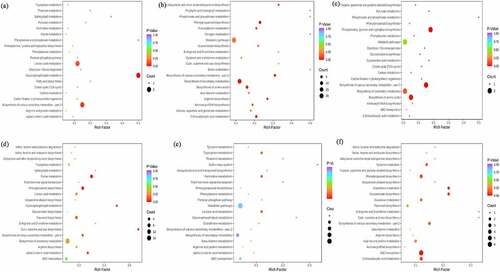
Figure 7. The kyoto encyclopedia of genes and genomes (KEGG) pathway enrichment between treatment MJ and BJ (Figure 7a), MJ and QJ (Figure 7b), MJ and YJ (Figure 7c), QJ and BJ (Figure 7d), YJ and BJ (Figure 7e), YJ and QJ (Figure 7f).